French vs Jamaican Receiving Food Stamps
COMPARE
French
Jamaican
Receiving Food Stamps
Receiving Food Stamps Comparison
French
Jamaicans
10.7%
RECEIVING FOOD STAMPS
92.3/ 100
METRIC RATING
131st/ 347
METRIC RANK
16.4%
RECEIVING FOOD STAMPS
0.0/ 100
METRIC RATING
306th/ 347
METRIC RANK
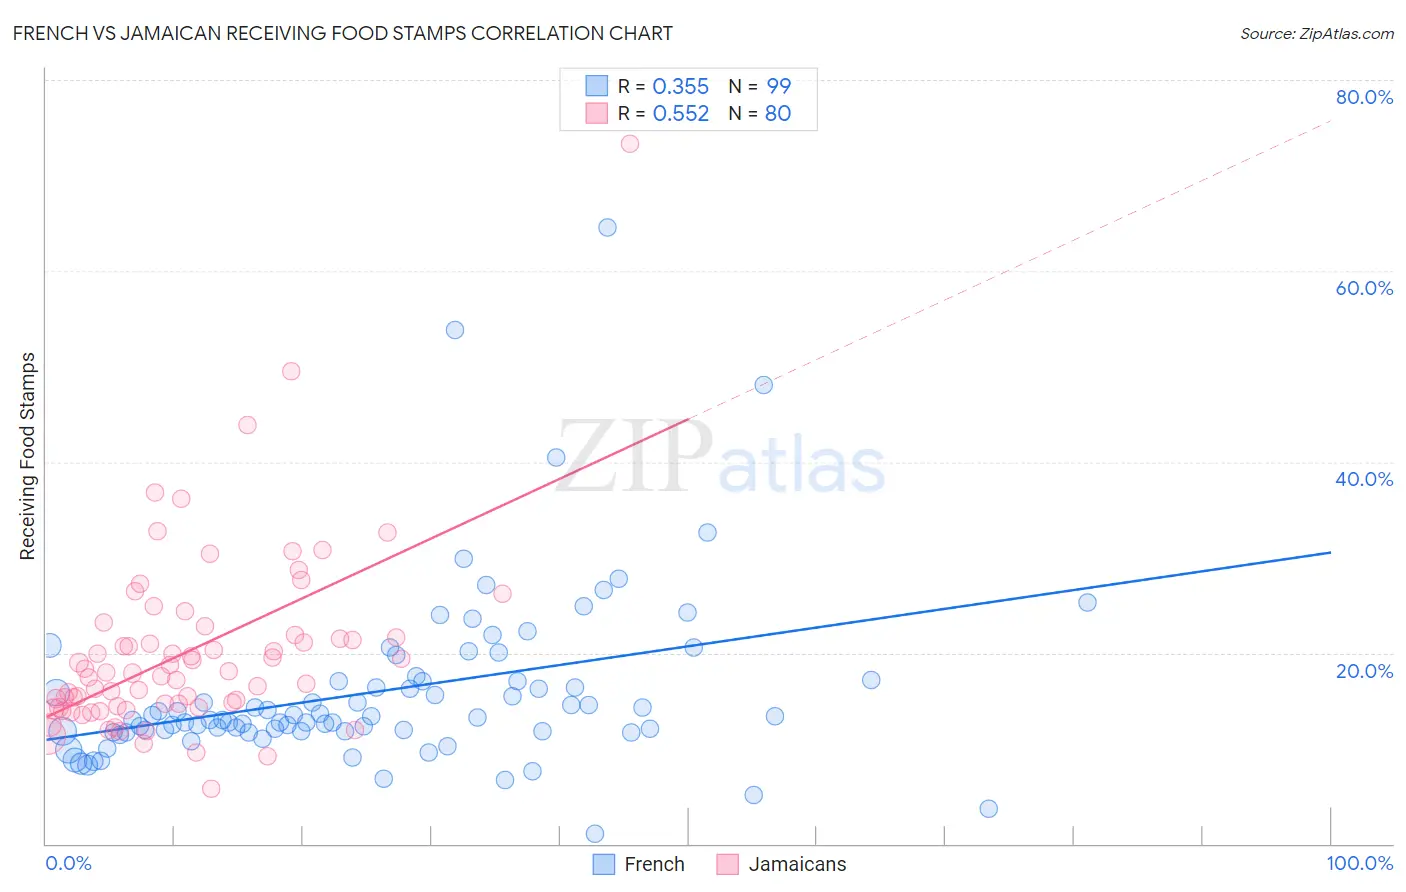
French vs Jamaican Receiving Food Stamps Correlation Chart
The statistical analysis conducted on geographies consisting of 568,765,352 people shows a mild positive correlation between the proportion of French and percentage of population receiving government assistance and/or food stamps in the United States with a correlation coefficient (R) of 0.355 and weighted average of 10.7%. Similarly, the statistical analysis conducted on geographies consisting of 367,071,648 people shows a substantial positive correlation between the proportion of Jamaicans and percentage of population receiving government assistance and/or food stamps in the United States with a correlation coefficient (R) of 0.552 and weighted average of 16.4%, a difference of 53.1%.
Receiving Food Stamps Correlation Summary
| Measurement | French | Jamaican |
| Minimum | 1.1% | 5.8% |
| Maximum | 64.6% | 73.3% |
| Range | 63.5% | 67.5% |
| Mean | 16.0% | 20.1% |
| Median | 13.3% | 17.9% |
| Interquartile 25% (IQ1) | 11.8% | 14.4% |
| Interquartile 75% (IQ3) | 17.1% | 21.7% |
| Interquartile Range (IQR) | 5.3% | 7.3% |
| Standard Deviation (Sample) | 9.4% | 9.8% |
| Standard Deviation (Population) | 9.3% | 9.7% |
Similar Demographics by Receiving Food Stamps
Demographics Similar to French by Receiving Food Stamps
In terms of receiving food stamps, the demographic groups most similar to French are Israeli (10.7%, a difference of 0.0%), Immigrants from Jordan (10.7%, a difference of 0.10%), Yugoslavian (10.7%, a difference of 0.10%), Immigrants from Ethiopia (10.7%, a difference of 0.11%), and Afghan (10.7%, a difference of 0.14%).
| Demographics | Rating | Rank | Receiving Food Stamps |
| Paraguayans | 93.0 /100 | #124 | Exceptional 10.7% |
| Ukrainians | 92.8 /100 | #125 | Exceptional 10.7% |
| Afghans | 92.6 /100 | #126 | Exceptional 10.7% |
| Immigrants | Ethiopia | 92.6 /100 | #127 | Exceptional 10.7% |
| Immigrants | Jordan | 92.5 /100 | #128 | Exceptional 10.7% |
| Yugoslavians | 92.5 /100 | #129 | Exceptional 10.7% |
| Israelis | 92.4 /100 | #130 | Exceptional 10.7% |
| French | 92.3 /100 | #131 | Exceptional 10.7% |
| Immigrants | Germany | 92.0 /100 | #132 | Exceptional 10.7% |
| Immigrants | Russia | 90.9 /100 | #133 | Exceptional 10.8% |
| Immigrants | Brazil | 90.3 /100 | #134 | Exceptional 10.8% |
| Argentineans | 90.2 /100 | #135 | Exceptional 10.8% |
| Slovaks | 89.8 /100 | #136 | Excellent 10.8% |
| Immigrants | Eastern Europe | 89.8 /100 | #137 | Excellent 10.8% |
| Immigrants | Moldova | 88.5 /100 | #138 | Excellent 10.9% |
Demographics Similar to Jamaicans by Receiving Food Stamps
In terms of receiving food stamps, the demographic groups most similar to Jamaicans are Immigrants from the Azores (16.4%, a difference of 0.070%), Houma (16.5%, a difference of 0.29%), Barbadian (16.5%, a difference of 0.55%), U.S. Virgin Islander (16.5%, a difference of 0.79%), and West Indian (16.3%, a difference of 0.94%).
| Demographics | Rating | Rank | Receiving Food Stamps |
| Hispanics or Latinos | 0.0 /100 | #299 | Tragic 15.8% |
| Immigrants | Bangladesh | 0.0 /100 | #300 | Tragic 15.9% |
| Trinidadians and Tobagonians | 0.0 /100 | #301 | Tragic 16.0% |
| Immigrants | West Indies | 0.0 /100 | #302 | Tragic 16.1% |
| Nicaraguans | 0.0 /100 | #303 | Tragic 16.1% |
| West Indians | 0.0 /100 | #304 | Tragic 16.3% |
| Immigrants | Azores | 0.0 /100 | #305 | Tragic 16.4% |
| Jamaicans | 0.0 /100 | #306 | Tragic 16.4% |
| Houma | 0.0 /100 | #307 | Tragic 16.5% |
| Barbadians | 0.0 /100 | #308 | Tragic 16.5% |
| U.S. Virgin Islanders | 0.0 /100 | #309 | Tragic 16.5% |
| Immigrants | Barbados | 0.0 /100 | #310 | Tragic 16.6% |
| Guyanese | 0.0 /100 | #311 | Tragic 16.7% |
| Sioux | 0.0 /100 | #312 | Tragic 16.8% |
| Immigrants | Jamaica | 0.0 /100 | #313 | Tragic 16.9% |