French vs Immigrants from Ethiopia Disability
COMPARE
French
Immigrants from Ethiopia
Disability
Disability Comparison
French
Immigrants from Ethiopia
13.2%
DISABILITY
0.0/ 100
METRIC RATING
299th/ 347
METRIC RANK
10.7%
DISABILITY
100.0/ 100
METRIC RATING
34th/ 347
METRIC RANK
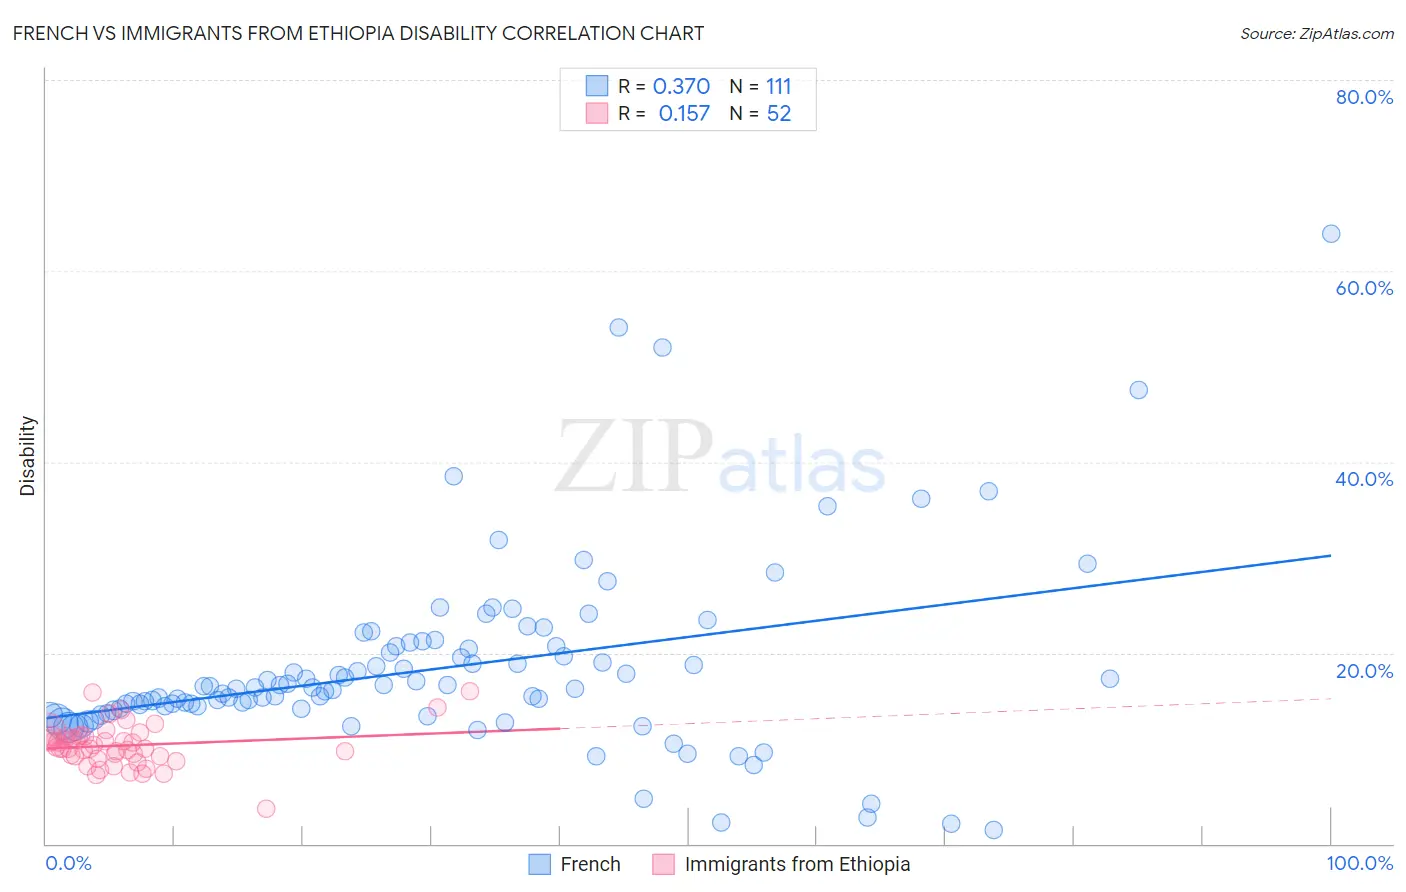
French vs Immigrants from Ethiopia Disability Correlation Chart
The statistical analysis conducted on geographies consisting of 572,283,731 people shows a mild positive correlation between the proportion of French and percentage of population with a disability in the United States with a correlation coefficient (R) of 0.370 and weighted average of 13.2%. Similarly, the statistical analysis conducted on geographies consisting of 211,552,130 people shows a poor positive correlation between the proportion of Immigrants from Ethiopia and percentage of population with a disability in the United States with a correlation coefficient (R) of 0.157 and weighted average of 10.7%, a difference of 23.1%.
Disability Correlation Summary
| Measurement | French | Immigrants from Ethiopia |
| Minimum | 1.5% | 3.7% |
| Maximum | 63.9% | 15.9% |
| Range | 62.4% | 12.3% |
| Mean | 18.3% | 10.3% |
| Median | 16.2% | 10.0% |
| Interquartile 25% (IQ1) | 13.9% | 9.2% |
| Interquartile 75% (IQ3) | 20.7% | 11.3% |
| Interquartile Range (IQR) | 6.7% | 2.1% |
| Standard Deviation (Sample) | 9.7% | 2.2% |
| Standard Deviation (Population) | 9.7% | 2.2% |
Similar Demographics by Disability
Demographics Similar to French by Disability
In terms of disability, the demographic groups most similar to French are Alaska Native (13.2%, a difference of 0.020%), Hopi (13.2%, a difference of 0.030%), Pennsylvania German (13.2%, a difference of 0.050%), Central American Indian (13.2%, a difference of 0.080%), and Nonimmigrants (13.2%, a difference of 0.12%).
| Demographics | Rating | Rank | Disability |
| Aleuts | 0.0 /100 | #292 | Tragic 13.1% |
| Marshallese | 0.0 /100 | #293 | Tragic 13.1% |
| Celtics | 0.0 /100 | #294 | Tragic 13.1% |
| Immigrants | Nonimmigrants | 0.0 /100 | #295 | Tragic 13.2% |
| Central American Indians | 0.0 /100 | #296 | Tragic 13.2% |
| Hopi | 0.0 /100 | #297 | Tragic 13.2% |
| Alaska Natives | 0.0 /100 | #298 | Tragic 13.2% |
| French | 0.0 /100 | #299 | Tragic 13.2% |
| Pennsylvania Germans | 0.0 /100 | #300 | Tragic 13.2% |
| Immigrants | Micronesia | 0.0 /100 | #301 | Tragic 13.2% |
| Arapaho | 0.0 /100 | #302 | Tragic 13.2% |
| Scotch-Irish | 0.0 /100 | #303 | Tragic 13.3% |
| Yakama | 0.0 /100 | #304 | Tragic 13.4% |
| French Canadians | 0.0 /100 | #305 | Tragic 13.4% |
| Cape Verdeans | 0.0 /100 | #306 | Tragic 13.5% |
Demographics Similar to Immigrants from Ethiopia by Disability
In terms of disability, the demographic groups most similar to Immigrants from Ethiopia are Immigrants from Indonesia (10.7%, a difference of 0.010%), Ethiopian (10.7%, a difference of 0.070%), Turkish (10.7%, a difference of 0.080%), Immigrants from Kuwait (10.7%, a difference of 0.22%), and Paraguayan (10.6%, a difference of 0.47%).
| Demographics | Rating | Rank | Disability |
| Cypriots | 100.0 /100 | #27 | Exceptional 10.6% |
| Egyptians | 100.0 /100 | #28 | Exceptional 10.6% |
| Immigrants | Argentina | 100.0 /100 | #29 | Exceptional 10.6% |
| Immigrants | Turkey | 100.0 /100 | #30 | Exceptional 10.6% |
| Immigrants | Egypt | 100.0 /100 | #31 | Exceptional 10.6% |
| Paraguayans | 100.0 /100 | #32 | Exceptional 10.6% |
| Immigrants | Kuwait | 100.0 /100 | #33 | Exceptional 10.7% |
| Immigrants | Ethiopia | 100.0 /100 | #34 | Exceptional 10.7% |
| Immigrants | Indonesia | 100.0 /100 | #35 | Exceptional 10.7% |
| Ethiopians | 100.0 /100 | #36 | Exceptional 10.7% |
| Turks | 100.0 /100 | #37 | Exceptional 10.7% |
| Afghans | 99.9 /100 | #38 | Exceptional 10.8% |
| Cambodians | 99.9 /100 | #39 | Exceptional 10.8% |
| Mongolians | 99.9 /100 | #40 | Exceptional 10.8% |
| Immigrants | Australia | 99.9 /100 | #41 | Exceptional 10.8% |