Immigrants from Eastern Europe vs Jamaican Disability
COMPARE
Immigrants from Eastern Europe
Jamaican
Disability
Disability Comparison
Immigrants from Eastern Europe
Jamaicans
11.3%
DISABILITY
96.3/ 100
METRIC RATING
106th/ 347
METRIC RANK
12.1%
DISABILITY
3.3/ 100
METRIC RATING
226th/ 347
METRIC RANK
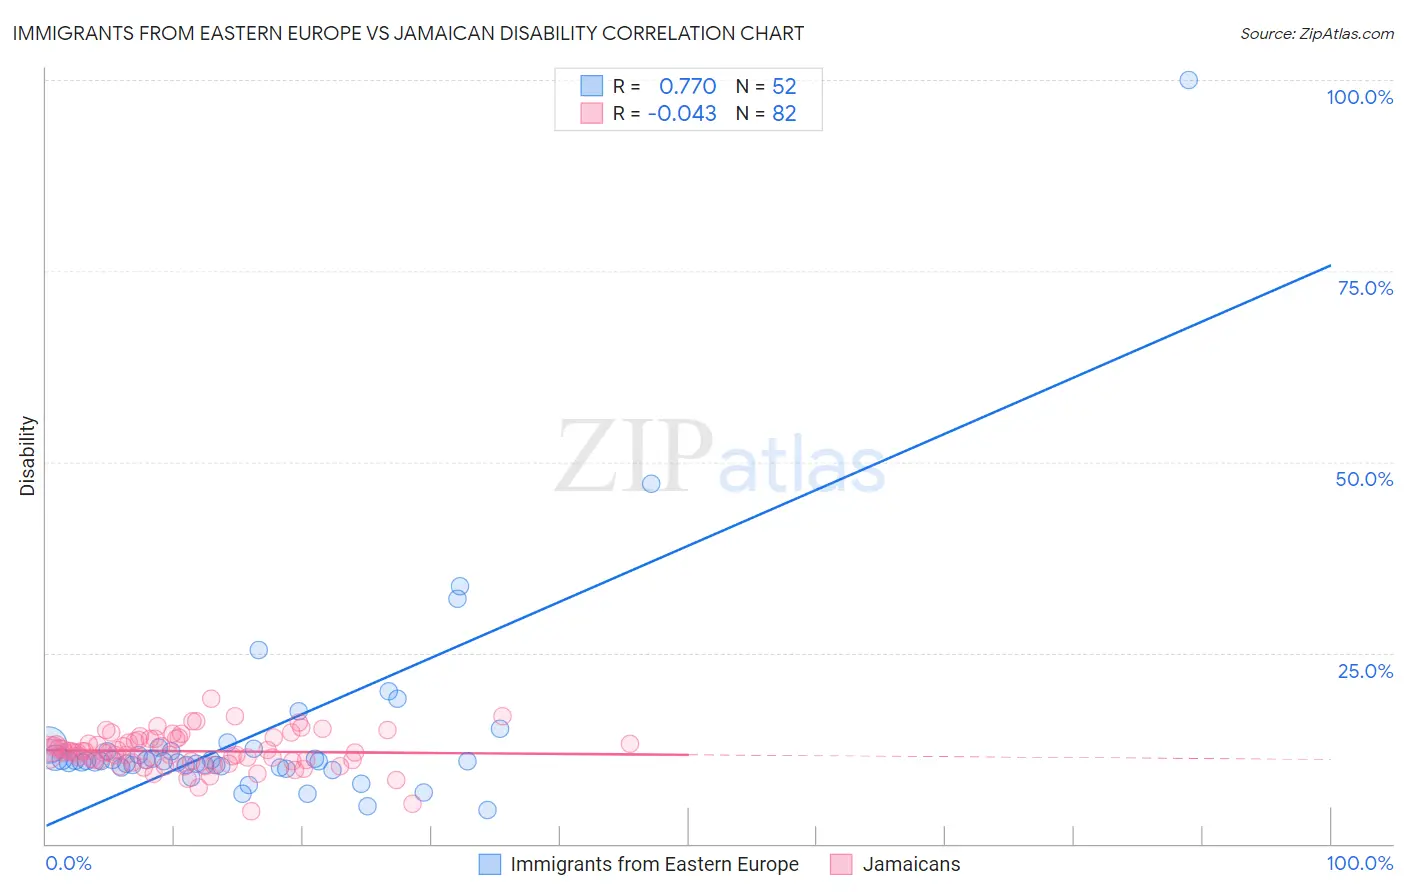
Immigrants from Eastern Europe vs Jamaican Disability Correlation Chart
The statistical analysis conducted on geographies consisting of 475,819,373 people shows a strong positive correlation between the proportion of Immigrants from Eastern Europe and percentage of population with a disability in the United States with a correlation coefficient (R) of 0.770 and weighted average of 11.3%. Similarly, the statistical analysis conducted on geographies consisting of 367,991,297 people shows no correlation between the proportion of Jamaicans and percentage of population with a disability in the United States with a correlation coefficient (R) of -0.043 and weighted average of 12.1%, a difference of 7.6%.
Disability Correlation Summary
| Measurement | Immigrants from Eastern Europe | Jamaican |
| Minimum | 4.4% | 4.3% |
| Maximum | 100.0% | 19.1% |
| Range | 95.6% | 14.8% |
| Mean | 14.4% | 12.1% |
| Median | 10.8% | 12.0% |
| Interquartile 25% (IQ1) | 10.2% | 10.8% |
| Interquartile 75% (IQ3) | 12.3% | 13.7% |
| Interquartile Range (IQR) | 2.1% | 2.9% |
| Standard Deviation (Sample) | 14.1% | 2.4% |
| Standard Deviation (Population) | 14.0% | 2.4% |
Similar Demographics by Disability
Demographics Similar to Immigrants from Eastern Europe by Disability
In terms of disability, the demographic groups most similar to Immigrants from Eastern Europe are Nicaraguan (11.3%, a difference of 0.020%), Immigrants from Kazakhstan (11.3%, a difference of 0.030%), Immigrants from Uruguay (11.3%, a difference of 0.040%), Immigrants (11.3%, a difference of 0.040%), and Immigrants from Nigeria (11.3%, a difference of 0.10%).
| Demographics | Rating | Rank | Disability |
| Immigrants | Czechoslovakia | 97.4 /100 | #99 | Exceptional 11.2% |
| Immigrants | Greece | 96.9 /100 | #100 | Exceptional 11.3% |
| Immigrants | Nicaragua | 96.8 /100 | #101 | Exceptional 11.3% |
| Immigrants | Eastern Africa | 96.7 /100 | #102 | Exceptional 11.3% |
| Immigrants | Uruguay | 96.4 /100 | #103 | Exceptional 11.3% |
| Immigrants | Immigrants | 96.4 /100 | #104 | Exceptional 11.3% |
| Immigrants | Kazakhstan | 96.4 /100 | #105 | Exceptional 11.3% |
| Immigrants | Eastern Europe | 96.3 /100 | #106 | Exceptional 11.3% |
| Nicaraguans | 96.2 /100 | #107 | Exceptional 11.3% |
| Immigrants | Nigeria | 96.0 /100 | #108 | Exceptional 11.3% |
| Immigrants | Uganda | 95.7 /100 | #109 | Exceptional 11.3% |
| Immigrants | Denmark | 95.6 /100 | #110 | Exceptional 11.3% |
| Immigrants | South Eastern Asia | 95.4 /100 | #111 | Exceptional 11.3% |
| Immigrants | Uzbekistan | 94.9 /100 | #112 | Exceptional 11.3% |
| Guyanese | 94.7 /100 | #113 | Exceptional 11.3% |
Demographics Similar to Jamaicans by Disability
In terms of disability, the demographic groups most similar to Jamaicans are Alsatian (12.1%, a difference of 0.010%), Senegalese (12.1%, a difference of 0.050%), Mexican (12.1%, a difference of 0.13%), West Indian (12.2%, a difference of 0.15%), and Inupiat (12.2%, a difference of 0.17%).
| Demographics | Rating | Rank | Disability |
| Croatians | 4.9 /100 | #219 | Tragic 12.1% |
| Immigrants | Bahamas | 4.7 /100 | #220 | Tragic 12.1% |
| Northern Europeans | 4.2 /100 | #221 | Tragic 12.1% |
| Spanish American Indians | 4.1 /100 | #222 | Tragic 12.1% |
| Hispanics or Latinos | 3.9 /100 | #223 | Tragic 12.1% |
| Mexicans | 3.7 /100 | #224 | Tragic 12.1% |
| Senegalese | 3.5 /100 | #225 | Tragic 12.1% |
| Jamaicans | 3.3 /100 | #226 | Tragic 12.1% |
| Alsatians | 3.3 /100 | #227 | Tragic 12.1% |
| West Indians | 2.9 /100 | #228 | Tragic 12.2% |
| Inupiat | 2.8 /100 | #229 | Tragic 12.2% |
| Samoans | 2.6 /100 | #230 | Tragic 12.2% |
| Malaysians | 2.5 /100 | #231 | Tragic 12.2% |
| Italians | 2.5 /100 | #232 | Tragic 12.2% |
| Bahamians | 2.3 /100 | #233 | Tragic 12.2% |