French Canadian vs Chinese Cognitive Disability
COMPARE
French Canadian
Chinese
Cognitive Disability
Cognitive Disability Comparison
French Canadians
Chinese
17.1%
COGNITIVE DISABILITY
85.7/ 100
METRIC RATING
148th/ 347
METRIC RANK
15.9%
COGNITIVE DISABILITY
100.0/ 100
METRIC RATING
3rd/ 347
METRIC RANK
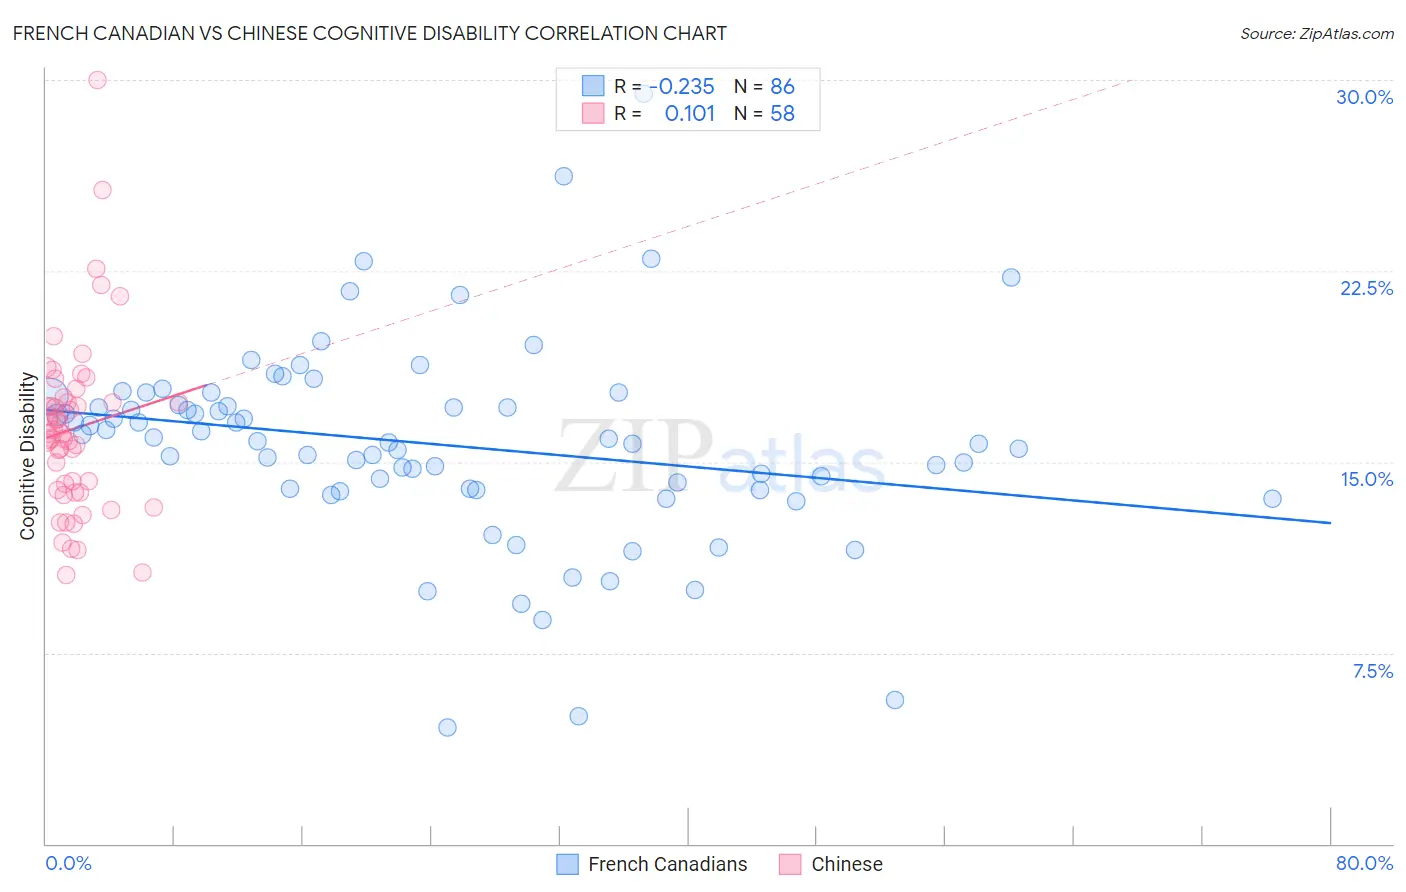
French Canadian vs Chinese Cognitive Disability Correlation Chart
The statistical analysis conducted on geographies consisting of 502,569,589 people shows a weak negative correlation between the proportion of French Canadians and percentage of population with cognitive disability in the United States with a correlation coefficient (R) of -0.235 and weighted average of 17.1%. Similarly, the statistical analysis conducted on geographies consisting of 64,802,428 people shows a poor positive correlation between the proportion of Chinese and percentage of population with cognitive disability in the United States with a correlation coefficient (R) of 0.101 and weighted average of 15.9%, a difference of 7.1%.
Cognitive Disability Correlation Summary
| Measurement | French Canadian | Chinese |
| Minimum | 4.5% | 10.5% |
| Maximum | 29.5% | 30.0% |
| Range | 24.9% | 19.5% |
| Mean | 15.7% | 16.3% |
| Median | 15.9% | 16.1% |
| Interquartile 25% (IQ1) | 13.9% | 13.9% |
| Interquartile 75% (IQ3) | 17.3% | 17.3% |
| Interquartile Range (IQR) | 3.3% | 3.4% |
| Standard Deviation (Sample) | 4.0% | 3.4% |
| Standard Deviation (Population) | 3.9% | 3.4% |
Similar Demographics by Cognitive Disability
Demographics Similar to French Canadians by Cognitive Disability
In terms of cognitive disability, the demographic groups most similar to French Canadians are Cypriot (17.1%, a difference of 0.0%), Scotch-Irish (17.1%, a difference of 0.010%), Basque (17.1%, a difference of 0.010%), Costa Rican (17.0%, a difference of 0.14%), and Syrian (17.1%, a difference of 0.15%).
| Demographics | Rating | Rank | Cognitive Disability |
| Aleuts | 89.9 /100 | #141 | Excellent 17.0% |
| Carpatho Rusyns | 89.6 /100 | #142 | Excellent 17.0% |
| British | 89.3 /100 | #143 | Excellent 17.0% |
| Immigrants | Brazil | 89.3 /100 | #144 | Excellent 17.0% |
| Immigrants | South Eastern Asia | 88.7 /100 | #145 | Excellent 17.0% |
| Costa Ricans | 88.0 /100 | #146 | Excellent 17.0% |
| Scotch-Irish | 85.9 /100 | #147 | Excellent 17.1% |
| French Canadians | 85.7 /100 | #148 | Excellent 17.1% |
| Cypriots | 85.7 /100 | #149 | Excellent 17.1% |
| Basques | 85.5 /100 | #150 | Excellent 17.1% |
| Syrians | 83.0 /100 | #151 | Excellent 17.1% |
| Immigrants | Indonesia | 82.7 /100 | #152 | Excellent 17.1% |
| Immigrants | Kazakhstan | 80.5 /100 | #153 | Excellent 17.1% |
| Immigrants | Malaysia | 79.3 /100 | #154 | Good 17.1% |
| Brazilians | 78.9 /100 | #155 | Good 17.1% |
Demographics Similar to Chinese by Cognitive Disability
In terms of cognitive disability, the demographic groups most similar to Chinese are Immigrants from India (15.9%, a difference of 0.080%), Immigrants from Lithuania (16.0%, a difference of 0.18%), Immigrants from Hong Kong (16.0%, a difference of 0.59%), Thai (16.1%, a difference of 1.2%), and Immigrants from Ireland (16.1%, a difference of 1.3%).
| Demographics | Rating | Rank | Cognitive Disability |
| Immigrants | Taiwan | 100.0 /100 | #1 | Exceptional 15.7% |
| Immigrants | India | 100.0 /100 | #2 | Exceptional 15.9% |
| Chinese | 100.0 /100 | #3 | Exceptional 15.9% |
| Immigrants | Lithuania | 100.0 /100 | #4 | Exceptional 16.0% |
| Immigrants | Hong Kong | 100.0 /100 | #5 | Exceptional 16.0% |
| Thais | 100.0 /100 | #6 | Exceptional 16.1% |
| Immigrants | Ireland | 100.0 /100 | #7 | Exceptional 16.1% |
| Immigrants | Poland | 100.0 /100 | #8 | Exceptional 16.1% |
| Assyrians/Chaldeans/Syriacs | 100.0 /100 | #9 | Exceptional 16.2% |
| Immigrants | Scotland | 100.0 /100 | #10 | Exceptional 16.2% |
| Immigrants | Czechoslovakia | 100.0 /100 | #11 | Exceptional 16.2% |
| Maltese | 100.0 /100 | #12 | Exceptional 16.2% |
| Lithuanians | 100.0 /100 | #13 | Exceptional 16.3% |
| Immigrants | Austria | 100.0 /100 | #14 | Exceptional 16.3% |
| Immigrants | Greece | 100.0 /100 | #15 | Exceptional 16.3% |