French Canadian vs Immigrants from Albania Cognitive Disability
COMPARE
French Canadian
Immigrants from Albania
Cognitive Disability
Cognitive Disability Comparison
French Canadians
Immigrants from Albania
17.1%
COGNITIVE DISABILITY
85.7/ 100
METRIC RATING
148th/ 347
METRIC RANK
17.2%
COGNITIVE DISABILITY
64.9/ 100
METRIC RATING
165th/ 347
METRIC RANK
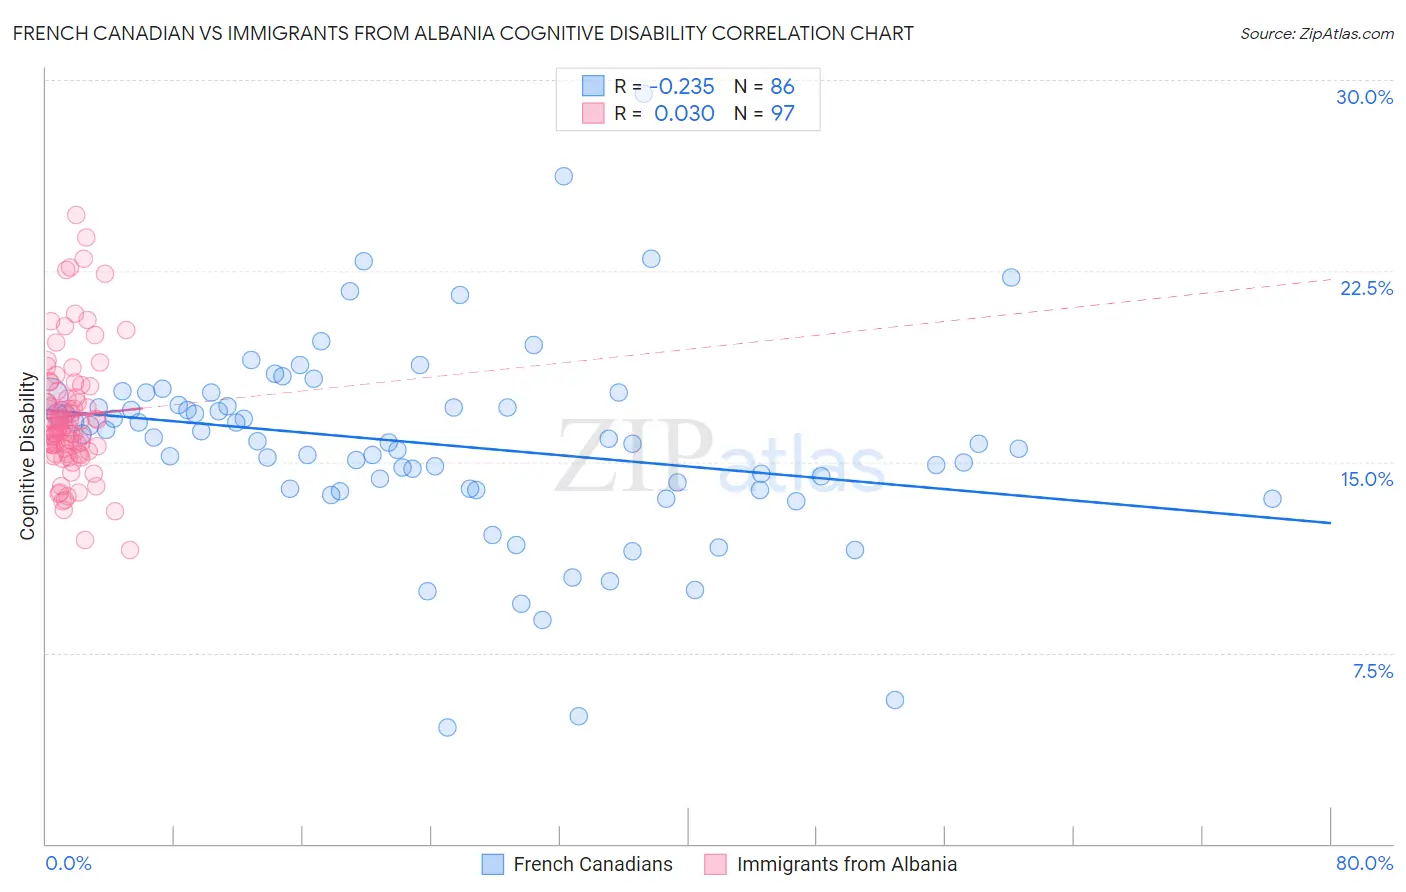
French Canadian vs Immigrants from Albania Cognitive Disability Correlation Chart
The statistical analysis conducted on geographies consisting of 502,569,589 people shows a weak negative correlation between the proportion of French Canadians and percentage of population with cognitive disability in the United States with a correlation coefficient (R) of -0.235 and weighted average of 17.1%. Similarly, the statistical analysis conducted on geographies consisting of 119,394,902 people shows no correlation between the proportion of Immigrants from Albania and percentage of population with cognitive disability in the United States with a correlation coefficient (R) of 0.030 and weighted average of 17.2%, a difference of 0.85%.
Cognitive Disability Correlation Summary
| Measurement | French Canadian | Immigrants from Albania |
| Minimum | 4.5% | 11.6% |
| Maximum | 29.5% | 24.7% |
| Range | 24.9% | 13.2% |
| Mean | 15.7% | 16.8% |
| Median | 15.9% | 16.4% |
| Interquartile 25% (IQ1) | 13.9% | 15.5% |
| Interquartile 75% (IQ3) | 17.3% | 17.7% |
| Interquartile Range (IQR) | 3.3% | 2.2% |
| Standard Deviation (Sample) | 4.0% | 2.4% |
| Standard Deviation (Population) | 3.9% | 2.4% |
Demographics Similar to French Canadians and Immigrants from Albania by Cognitive Disability
In terms of cognitive disability, the demographic groups most similar to French Canadians are Cypriot (17.1%, a difference of 0.0%), Scotch-Irish (17.1%, a difference of 0.010%), Basque (17.1%, a difference of 0.010%), Costa Rican (17.0%, a difference of 0.14%), and Syrian (17.1%, a difference of 0.15%). Similarly, the demographic groups most similar to Immigrants from Albania are Immigrants from Ecuador (17.2%, a difference of 0.010%), Armenian (17.2%, a difference of 0.17%), Yugoslavian (17.2%, a difference of 0.22%), Immigrants from Switzerland (17.2%, a difference of 0.22%), and American (17.2%, a difference of 0.24%).
| Demographics | Rating | Rank | Cognitive Disability |
| Costa Ricans | 88.0 /100 | #146 | Excellent 17.0% |
| Scotch-Irish | 85.9 /100 | #147 | Excellent 17.1% |
| French Canadians | 85.7 /100 | #148 | Excellent 17.1% |
| Cypriots | 85.7 /100 | #149 | Excellent 17.1% |
| Basques | 85.5 /100 | #150 | Excellent 17.1% |
| Syrians | 83.0 /100 | #151 | Excellent 17.1% |
| Immigrants | Indonesia | 82.7 /100 | #152 | Excellent 17.1% |
| Immigrants | Kazakhstan | 80.5 /100 | #153 | Excellent 17.1% |
| Immigrants | Malaysia | 79.3 /100 | #154 | Good 17.1% |
| Brazilians | 78.9 /100 | #155 | Good 17.1% |
| Sri Lankans | 78.9 /100 | #156 | Good 17.1% |
| Immigrants | Australia | 76.0 /100 | #157 | Good 17.1% |
| Celtics | 74.1 /100 | #158 | Good 17.1% |
| Immigrants | Latvia | 73.2 /100 | #159 | Good 17.2% |
| Australians | 72.4 /100 | #160 | Good 17.2% |
| Americans | 72.2 /100 | #161 | Good 17.2% |
| Yugoslavians | 71.6 /100 | #162 | Good 17.2% |
| Immigrants | Switzerland | 71.5 /100 | #163 | Good 17.2% |
| Armenians | 70.1 /100 | #164 | Good 17.2% |
| Immigrants | Albania | 64.9 /100 | #165 | Good 17.2% |
| Immigrants | Ecuador | 64.4 /100 | #166 | Good 17.2% |