French Canadian vs Immigrants from the Azores Cognitive Disability
COMPARE
French Canadian
Immigrants from the Azores
Cognitive Disability
Cognitive Disability Comparison
French Canadians
Immigrants from the Azores
17.1%
COGNITIVE DISABILITY
85.7/ 100
METRIC RATING
148th/ 347
METRIC RANK
17.9%
COGNITIVE DISABILITY
0.6/ 100
METRIC RATING
255th/ 347
METRIC RANK
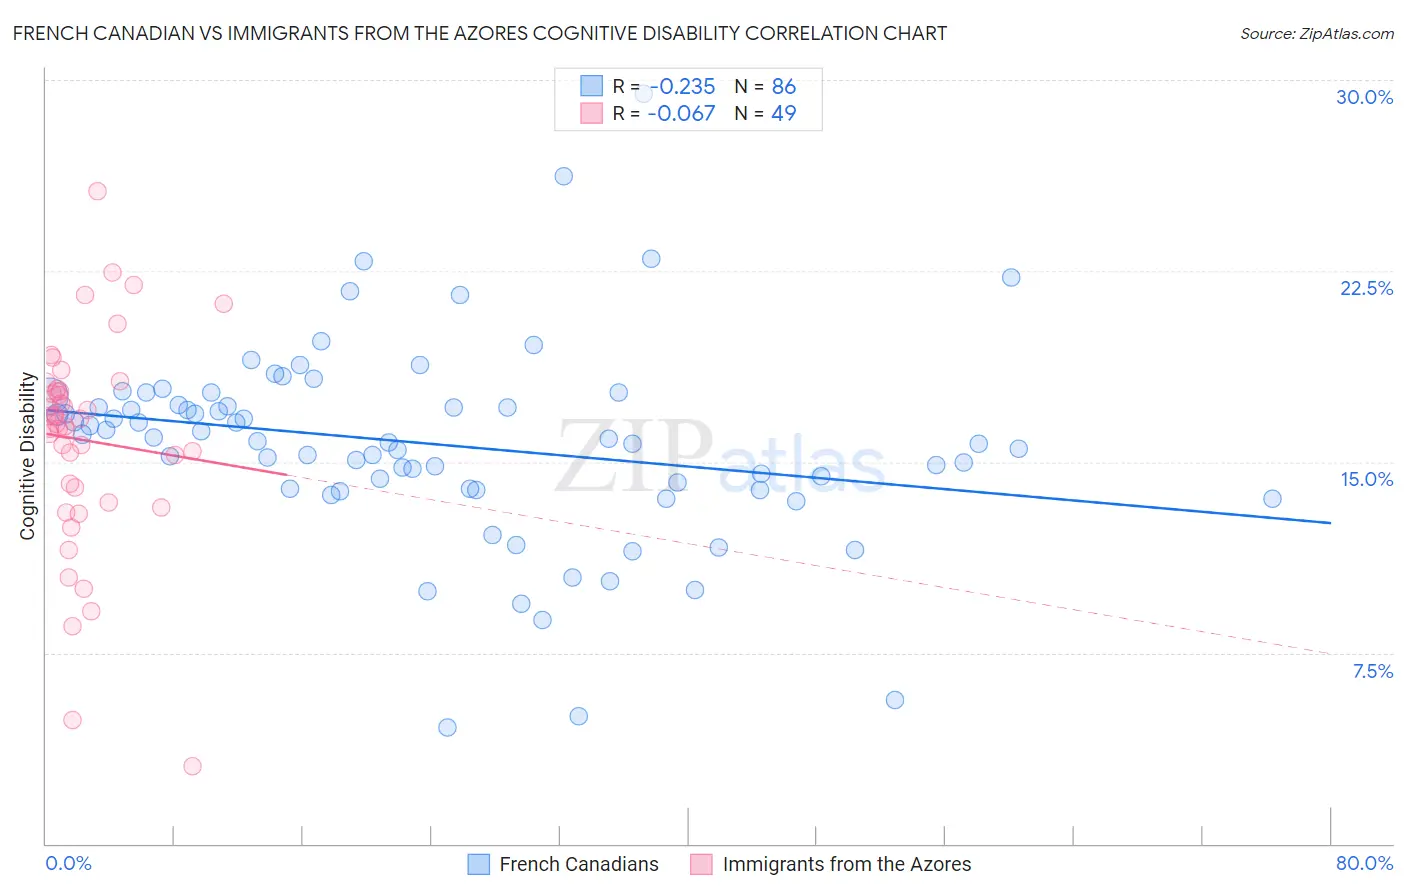
French Canadian vs Immigrants from the Azores Cognitive Disability Correlation Chart
The statistical analysis conducted on geographies consisting of 502,569,589 people shows a weak negative correlation between the proportion of French Canadians and percentage of population with cognitive disability in the United States with a correlation coefficient (R) of -0.235 and weighted average of 17.1%. Similarly, the statistical analysis conducted on geographies consisting of 46,257,310 people shows a slight negative correlation between the proportion of Immigrants from the Azores and percentage of population with cognitive disability in the United States with a correlation coefficient (R) of -0.067 and weighted average of 17.9%, a difference of 5.0%.
Cognitive Disability Correlation Summary
| Measurement | French Canadian | Immigrants from the Azores |
| Minimum | 4.5% | 3.0% |
| Maximum | 29.5% | 25.6% |
| Range | 24.9% | 22.6% |
| Mean | 15.7% | 15.9% |
| Median | 15.9% | 16.5% |
| Interquartile 25% (IQ1) | 13.9% | 13.7% |
| Interquartile 75% (IQ3) | 17.3% | 17.8% |
| Interquartile Range (IQR) | 3.3% | 4.1% |
| Standard Deviation (Sample) | 4.0% | 4.2% |
| Standard Deviation (Population) | 3.9% | 4.1% |
Similar Demographics by Cognitive Disability
Demographics Similar to French Canadians by Cognitive Disability
In terms of cognitive disability, the demographic groups most similar to French Canadians are Cypriot (17.1%, a difference of 0.0%), Scotch-Irish (17.1%, a difference of 0.010%), Basque (17.1%, a difference of 0.010%), Costa Rican (17.0%, a difference of 0.14%), and Syrian (17.1%, a difference of 0.15%).
| Demographics | Rating | Rank | Cognitive Disability |
| Aleuts | 89.9 /100 | #141 | Excellent 17.0% |
| Carpatho Rusyns | 89.6 /100 | #142 | Excellent 17.0% |
| British | 89.3 /100 | #143 | Excellent 17.0% |
| Immigrants | Brazil | 89.3 /100 | #144 | Excellent 17.0% |
| Immigrants | South Eastern Asia | 88.7 /100 | #145 | Excellent 17.0% |
| Costa Ricans | 88.0 /100 | #146 | Excellent 17.0% |
| Scotch-Irish | 85.9 /100 | #147 | Excellent 17.1% |
| French Canadians | 85.7 /100 | #148 | Excellent 17.1% |
| Cypriots | 85.7 /100 | #149 | Excellent 17.1% |
| Basques | 85.5 /100 | #150 | Excellent 17.1% |
| Syrians | 83.0 /100 | #151 | Excellent 17.1% |
| Immigrants | Indonesia | 82.7 /100 | #152 | Excellent 17.1% |
| Immigrants | Kazakhstan | 80.5 /100 | #153 | Excellent 17.1% |
| Immigrants | Malaysia | 79.3 /100 | #154 | Good 17.1% |
| Brazilians | 78.9 /100 | #155 | Good 17.1% |
Demographics Similar to Immigrants from the Azores by Cognitive Disability
In terms of cognitive disability, the demographic groups most similar to Immigrants from the Azores are Hispanic or Latino (17.9%, a difference of 0.0%), Bahamian (17.9%, a difference of 0.0%), Hopi (17.9%, a difference of 0.010%), Immigrants from Grenada (17.9%, a difference of 0.020%), and Malaysian (17.9%, a difference of 0.030%).
| Demographics | Rating | Rank | Cognitive Disability |
| French American Indians | 0.7 /100 | #248 | Tragic 17.9% |
| Cree | 0.7 /100 | #249 | Tragic 17.9% |
| Immigrants | Ethiopia | 0.7 /100 | #250 | Tragic 17.9% |
| Malaysians | 0.6 /100 | #251 | Tragic 17.9% |
| Immigrants | Grenada | 0.6 /100 | #252 | Tragic 17.9% |
| Hopi | 0.6 /100 | #253 | Tragic 17.9% |
| Hispanics or Latinos | 0.6 /100 | #254 | Tragic 17.9% |
| Immigrants | Azores | 0.6 /100 | #255 | Tragic 17.9% |
| Bahamians | 0.6 /100 | #256 | Tragic 17.9% |
| Mexican American Indians | 0.6 /100 | #257 | Tragic 17.9% |
| Immigrants | Armenia | 0.6 /100 | #258 | Tragic 17.9% |
| Ethiopians | 0.5 /100 | #259 | Tragic 17.9% |
| Immigrants | Belize | 0.5 /100 | #260 | Tragic 17.9% |
| Guamanians/Chamorros | 0.5 /100 | #261 | Tragic 17.9% |
| Sierra Leoneans | 0.4 /100 | #262 | Tragic 17.9% |