French Canadian vs Latvian Cognitive Disability
COMPARE
French Canadian
Latvian
Cognitive Disability
Cognitive Disability Comparison
French Canadians
Latvians
17.1%
COGNITIVE DISABILITY
85.7/ 100
METRIC RATING
148th/ 347
METRIC RANK
16.6%
COGNITIVE DISABILITY
99.5/ 100
METRIC RATING
67th/ 347
METRIC RANK
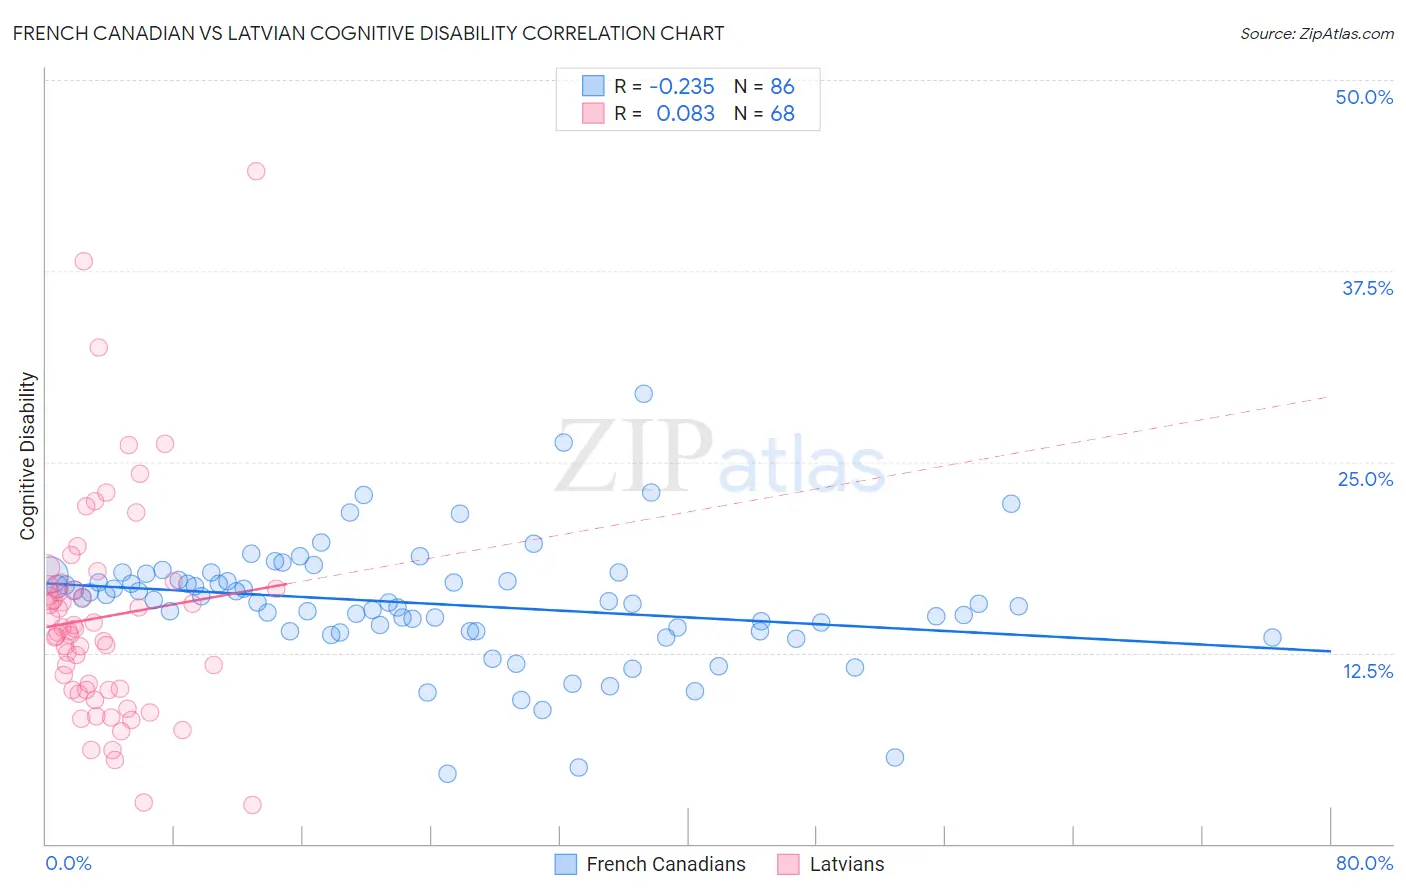
French Canadian vs Latvian Cognitive Disability Correlation Chart
The statistical analysis conducted on geographies consisting of 502,569,589 people shows a weak negative correlation between the proportion of French Canadians and percentage of population with cognitive disability in the United States with a correlation coefficient (R) of -0.235 and weighted average of 17.1%. Similarly, the statistical analysis conducted on geographies consisting of 220,719,023 people shows a slight positive correlation between the proportion of Latvians and percentage of population with cognitive disability in the United States with a correlation coefficient (R) of 0.083 and weighted average of 16.6%, a difference of 2.5%.
Cognitive Disability Correlation Summary
| Measurement | French Canadian | Latvian |
| Minimum | 4.5% | 2.6% |
| Maximum | 29.5% | 44.0% |
| Range | 24.9% | 41.5% |
| Mean | 15.7% | 14.8% |
| Median | 15.9% | 14.0% |
| Interquartile 25% (IQ1) | 13.9% | 10.1% |
| Interquartile 75% (IQ3) | 17.3% | 16.8% |
| Interquartile Range (IQR) | 3.3% | 6.7% |
| Standard Deviation (Sample) | 4.0% | 7.2% |
| Standard Deviation (Population) | 3.9% | 7.2% |
Similar Demographics by Cognitive Disability
Demographics Similar to French Canadians by Cognitive Disability
In terms of cognitive disability, the demographic groups most similar to French Canadians are Cypriot (17.1%, a difference of 0.0%), Scotch-Irish (17.1%, a difference of 0.010%), Basque (17.1%, a difference of 0.010%), Costa Rican (17.0%, a difference of 0.14%), and Syrian (17.1%, a difference of 0.15%).
| Demographics | Rating | Rank | Cognitive Disability |
| Aleuts | 89.9 /100 | #141 | Excellent 17.0% |
| Carpatho Rusyns | 89.6 /100 | #142 | Excellent 17.0% |
| British | 89.3 /100 | #143 | Excellent 17.0% |
| Immigrants | Brazil | 89.3 /100 | #144 | Excellent 17.0% |
| Immigrants | South Eastern Asia | 88.7 /100 | #145 | Excellent 17.0% |
| Costa Ricans | 88.0 /100 | #146 | Excellent 17.0% |
| Scotch-Irish | 85.9 /100 | #147 | Excellent 17.1% |
| French Canadians | 85.7 /100 | #148 | Excellent 17.1% |
| Cypriots | 85.7 /100 | #149 | Excellent 17.1% |
| Basques | 85.5 /100 | #150 | Excellent 17.1% |
| Syrians | 83.0 /100 | #151 | Excellent 17.1% |
| Immigrants | Indonesia | 82.7 /100 | #152 | Excellent 17.1% |
| Immigrants | Kazakhstan | 80.5 /100 | #153 | Excellent 17.1% |
| Immigrants | Malaysia | 79.3 /100 | #154 | Good 17.1% |
| Brazilians | 78.9 /100 | #155 | Good 17.1% |
Demographics Similar to Latvians by Cognitive Disability
In terms of cognitive disability, the demographic groups most similar to Latvians are Immigrants from Ukraine (16.6%, a difference of 0.040%), Ukrainian (16.6%, a difference of 0.040%), Immigrants from Uzbekistan (16.7%, a difference of 0.12%), Immigrants from Sweden (16.7%, a difference of 0.13%), and Immigrants from Belgium (16.7%, a difference of 0.14%).
| Demographics | Rating | Rank | Cognitive Disability |
| Romanians | 99.7 /100 | #60 | Exceptional 16.6% |
| Immigrants | England | 99.6 /100 | #61 | Exceptional 16.6% |
| Czechoslovakians | 99.6 /100 | #62 | Exceptional 16.6% |
| Argentineans | 99.6 /100 | #63 | Exceptional 16.6% |
| Venezuelans | 99.6 /100 | #64 | Exceptional 16.6% |
| Colombians | 99.6 /100 | #65 | Exceptional 16.6% |
| Immigrants | Ukraine | 99.5 /100 | #66 | Exceptional 16.6% |
| Latvians | 99.5 /100 | #67 | Exceptional 16.6% |
| Ukrainians | 99.4 /100 | #68 | Exceptional 16.6% |
| Immigrants | Uzbekistan | 99.4 /100 | #69 | Exceptional 16.7% |
| Immigrants | Sweden | 99.4 /100 | #70 | Exceptional 16.7% |
| Immigrants | Belgium | 99.3 /100 | #71 | Exceptional 16.7% |
| Germans | 99.3 /100 | #72 | Exceptional 16.7% |
| Burmese | 99.3 /100 | #73 | Exceptional 16.7% |
| Slavs | 99.3 /100 | #74 | Exceptional 16.7% |