Bolivian vs Subsaharan African Disability Age 5 to 17
COMPARE
Bolivian
Subsaharan African
Disability Age 5 to 17
Disability Age 5 to 17 Comparison
Bolivians
Sub-Saharan Africans
5.0%
DISABILITY AGE 5 TO 17
100.0/ 100
METRIC RATING
35th/ 347
METRIC RANK
6.2%
DISABILITY AGE 5 TO 17
0.0/ 100
METRIC RATING
284th/ 347
METRIC RANK
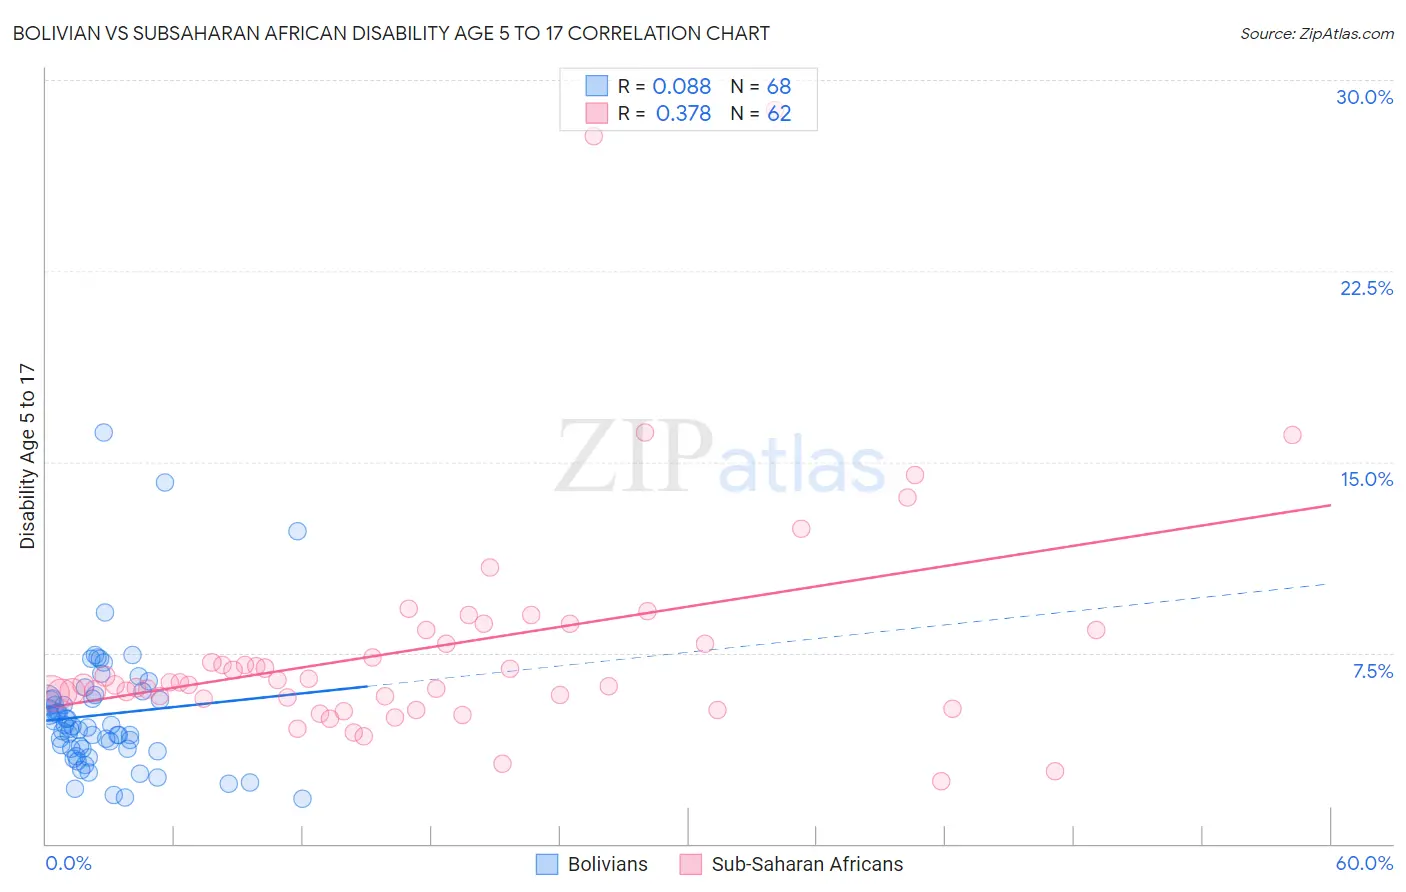
Bolivian vs Subsaharan African Disability Age 5 to 17 Correlation Chart
The statistical analysis conducted on geographies consisting of 184,162,509 people shows a slight positive correlation between the proportion of Bolivians and percentage of population with a disability between the ages 5 and 17 in the United States with a correlation coefficient (R) of 0.088 and weighted average of 5.0%. Similarly, the statistical analysis conducted on geographies consisting of 502,132,058 people shows a mild positive correlation between the proportion of Sub-Saharan Africans and percentage of population with a disability between the ages 5 and 17 in the United States with a correlation coefficient (R) of 0.378 and weighted average of 6.2%, a difference of 23.1%.
Disability Age 5 to 17 Correlation Summary
| Measurement | Bolivian | Subsaharan African |
| Minimum | 1.8% | 2.5% |
| Maximum | 16.1% | 28.8% |
| Range | 14.4% | 26.3% |
| Mean | 5.1% | 7.7% |
| Median | 4.6% | 6.3% |
| Interquartile 25% (IQ1) | 3.7% | 5.7% |
| Interquartile 75% (IQ3) | 5.7% | 8.4% |
| Interquartile Range (IQR) | 1.9% | 2.7% |
| Standard Deviation (Sample) | 2.5% | 4.7% |
| Standard Deviation (Population) | 2.5% | 4.6% |
Similar Demographics by Disability Age 5 to 17
Demographics Similar to Bolivians by Disability Age 5 to 17
In terms of disability age 5 to 17, the demographic groups most similar to Bolivians are Immigrants from Egypt (5.0%, a difference of 0.050%), Immigrants from Belarus (5.0%, a difference of 0.070%), Immigrants from Philippines (5.0%, a difference of 0.11%), Immigrants from Argentina (5.0%, a difference of 0.12%), and Israeli (5.0%, a difference of 0.19%).
| Demographics | Rating | Rank | Disability Age 5 to 17 |
| Immigrants | Japan | 100.0 /100 | #28 | Exceptional 4.9% |
| Immigrants | Serbia | 100.0 /100 | #29 | Exceptional 4.9% |
| Immigrants | Malaysia | 100.0 /100 | #30 | Exceptional 5.0% |
| Immigrants | Pakistan | 100.0 /100 | #31 | Exceptional 5.0% |
| Soviet Union | 100.0 /100 | #32 | Exceptional 5.0% |
| Immigrants | Indonesia | 100.0 /100 | #33 | Exceptional 5.0% |
| Israelis | 100.0 /100 | #34 | Exceptional 5.0% |
| Bolivians | 100.0 /100 | #35 | Exceptional 5.0% |
| Immigrants | Egypt | 100.0 /100 | #36 | Exceptional 5.0% |
| Immigrants | Belarus | 100.0 /100 | #37 | Exceptional 5.0% |
| Immigrants | Philippines | 100.0 /100 | #38 | Exceptional 5.0% |
| Immigrants | Argentina | 100.0 /100 | #39 | Exceptional 5.0% |
| Okinawans | 100.0 /100 | #40 | Exceptional 5.0% |
| Immigrants | Australia | 100.0 /100 | #41 | Exceptional 5.0% |
| Immigrants | Sri Lanka | 100.0 /100 | #42 | Exceptional 5.0% |
Demographics Similar to Sub-Saharan Africans by Disability Age 5 to 17
In terms of disability age 5 to 17, the demographic groups most similar to Sub-Saharan Africans are English (6.2%, a difference of 0.0%), Ugandan (6.2%, a difference of 0.030%), Colville (6.2%, a difference of 0.040%), German (6.1%, a difference of 0.19%), and Pima (6.2%, a difference of 0.23%).
| Demographics | Rating | Rank | Disability Age 5 to 17 |
| Puget Sound Salish | 0.1 /100 | #277 | Tragic 6.1% |
| Immigrants | Liberia | 0.1 /100 | #278 | Tragic 6.1% |
| Immigrants | Jamaica | 0.1 /100 | #279 | Tragic 6.1% |
| Portuguese | 0.1 /100 | #280 | Tragic 6.1% |
| Scottish | 0.0 /100 | #281 | Tragic 6.1% |
| Germans | 0.0 /100 | #282 | Tragic 6.1% |
| Ugandans | 0.0 /100 | #283 | Tragic 6.2% |
| Sub-Saharan Africans | 0.0 /100 | #284 | Tragic 6.2% |
| English | 0.0 /100 | #285 | Tragic 6.2% |
| Colville | 0.0 /100 | #286 | Tragic 6.2% |
| Pima | 0.0 /100 | #287 | Tragic 6.2% |
| Jamaicans | 0.0 /100 | #288 | Tragic 6.2% |
| Yaqui | 0.0 /100 | #289 | Tragic 6.2% |
| Immigrants | Congo | 0.0 /100 | #290 | Tragic 6.2% |
| Whites/Caucasians | 0.0 /100 | #291 | Tragic 6.2% |