Cuban vs Immigrants from Belize Ambulatory Disability
COMPARE
Cuban
Immigrants from Belize
Ambulatory Disability
Ambulatory Disability Comparison
Cubans
Immigrants from Belize
6.4%
AMBULATORY DISABILITY
4.0/ 100
METRIC RATING
227th/ 347
METRIC RANK
6.6%
AMBULATORY DISABILITY
0.4/ 100
METRIC RATING
260th/ 347
METRIC RANK
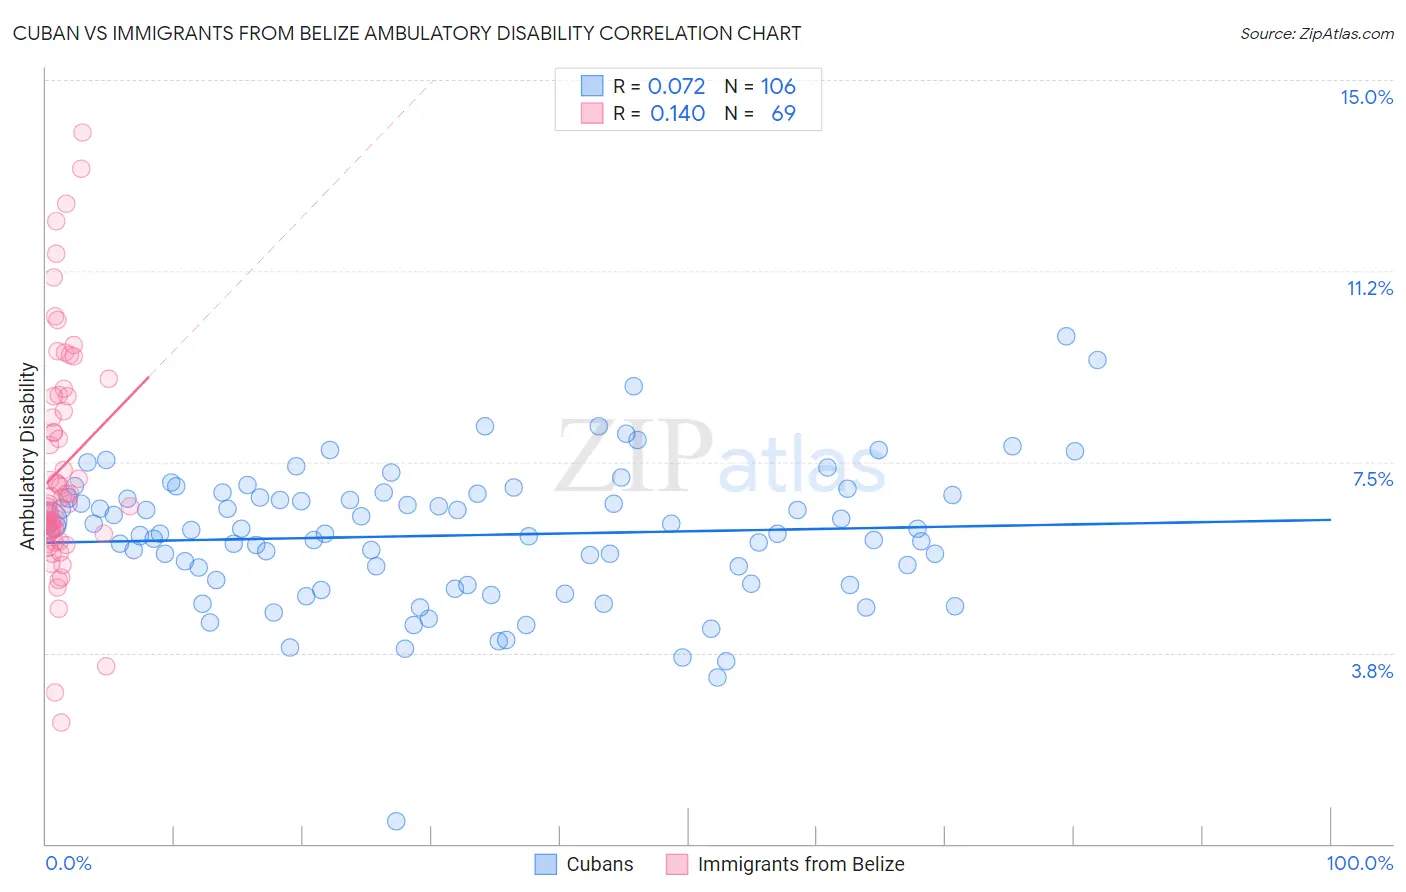
Cuban vs Immigrants from Belize Ambulatory Disability Correlation Chart
The statistical analysis conducted on geographies consisting of 449,114,501 people shows a slight positive correlation between the proportion of Cubans and percentage of population with ambulatory disability in the United States with a correlation coefficient (R) of 0.072 and weighted average of 6.4%. Similarly, the statistical analysis conducted on geographies consisting of 130,290,767 people shows a poor positive correlation between the proportion of Immigrants from Belize and percentage of population with ambulatory disability in the United States with a correlation coefficient (R) of 0.140 and weighted average of 6.6%, a difference of 2.9%.
Ambulatory Disability Correlation Summary
| Measurement | Cuban | Immigrants from Belize |
| Minimum | 0.45% | 2.4% |
| Maximum | 10.0% | 14.0% |
| Range | 9.5% | 11.6% |
| Mean | 6.1% | 7.4% |
| Median | 6.1% | 6.7% |
| Interquartile 25% (IQ1) | 5.1% | 6.1% |
| Interquartile 75% (IQ3) | 6.9% | 8.8% |
| Interquartile Range (IQR) | 1.7% | 2.7% |
| Standard Deviation (Sample) | 1.4% | 2.3% |
| Standard Deviation (Population) | 1.4% | 2.2% |
Similar Demographics by Ambulatory Disability
Demographics Similar to Cubans by Ambulatory Disability
In terms of ambulatory disability, the demographic groups most similar to Cubans are Portuguese (6.4%, a difference of 0.010%), Czechoslovakian (6.4%, a difference of 0.060%), Mexican (6.4%, a difference of 0.17%), Panamanian (6.4%, a difference of 0.32%), and Slavic (6.4%, a difference of 0.33%).
| Demographics | Rating | Rank | Ambulatory Disability |
| Immigrants | Albania | 9.6 /100 | #220 | Tragic 6.3% |
| Hungarians | 9.6 /100 | #221 | Tragic 6.3% |
| German Russians | 9.4 /100 | #222 | Tragic 6.3% |
| Immigrants | Honduras | 7.6 /100 | #223 | Tragic 6.3% |
| Liberians | 7.1 /100 | #224 | Tragic 6.3% |
| Hondurans | 6.3 /100 | #225 | Tragic 6.3% |
| Slavs | 5.1 /100 | #226 | Tragic 6.4% |
| Cubans | 4.0 /100 | #227 | Tragic 6.4% |
| Portuguese | 4.0 /100 | #228 | Tragic 6.4% |
| Czechoslovakians | 3.8 /100 | #229 | Tragic 6.4% |
| Mexicans | 3.5 /100 | #230 | Tragic 6.4% |
| Panamanians | 3.1 /100 | #231 | Tragic 6.4% |
| Assyrians/Chaldeans/Syriacs | 2.4 /100 | #232 | Tragic 6.4% |
| Sub-Saharan Africans | 2.3 /100 | #233 | Tragic 6.4% |
| Immigrants | Liberia | 2.3 /100 | #234 | Tragic 6.4% |
Demographics Similar to Immigrants from Belize by Ambulatory Disability
In terms of ambulatory disability, the demographic groups most similar to Immigrants from Belize are Aleut (6.6%, a difference of 0.010%), Irish (6.6%, a difference of 0.070%), Spanish American Indian (6.5%, a difference of 0.19%), English (6.6%, a difference of 0.24%), and Bermudan (6.5%, a difference of 0.27%).
| Demographics | Rating | Rank | Ambulatory Disability |
| Scottish | 0.7 /100 | #253 | Tragic 6.5% |
| Belizeans | 0.7 /100 | #254 | Tragic 6.5% |
| Welsh | 0.6 /100 | #255 | Tragic 6.5% |
| Immigrants | Uzbekistan | 0.6 /100 | #256 | Tragic 6.5% |
| Bermudans | 0.5 /100 | #257 | Tragic 6.5% |
| Spanish American Indians | 0.5 /100 | #258 | Tragic 6.5% |
| Aleuts | 0.4 /100 | #259 | Tragic 6.6% |
| Immigrants | Belize | 0.4 /100 | #260 | Tragic 6.6% |
| Irish | 0.4 /100 | #261 | Tragic 6.6% |
| English | 0.4 /100 | #262 | Tragic 6.6% |
| Hmong | 0.3 /100 | #263 | Tragic 6.6% |
| Nepalese | 0.2 /100 | #264 | Tragic 6.6% |
| Bahamians | 0.2 /100 | #265 | Tragic 6.6% |
| Guyanese | 0.2 /100 | #266 | Tragic 6.6% |
| Trinidadians and Tobagonians | 0.2 /100 | #267 | Tragic 6.6% |