Immigrants from Sweden vs Immigrants from Belize Ambulatory Disability
COMPARE
Immigrants from Sweden
Immigrants from Belize
Ambulatory Disability
Ambulatory Disability Comparison
Immigrants from Sweden
Immigrants from Belize
5.6%
AMBULATORY DISABILITY
99.9/ 100
METRIC RATING
45th/ 347
METRIC RANK
6.6%
AMBULATORY DISABILITY
0.4/ 100
METRIC RATING
260th/ 347
METRIC RANK
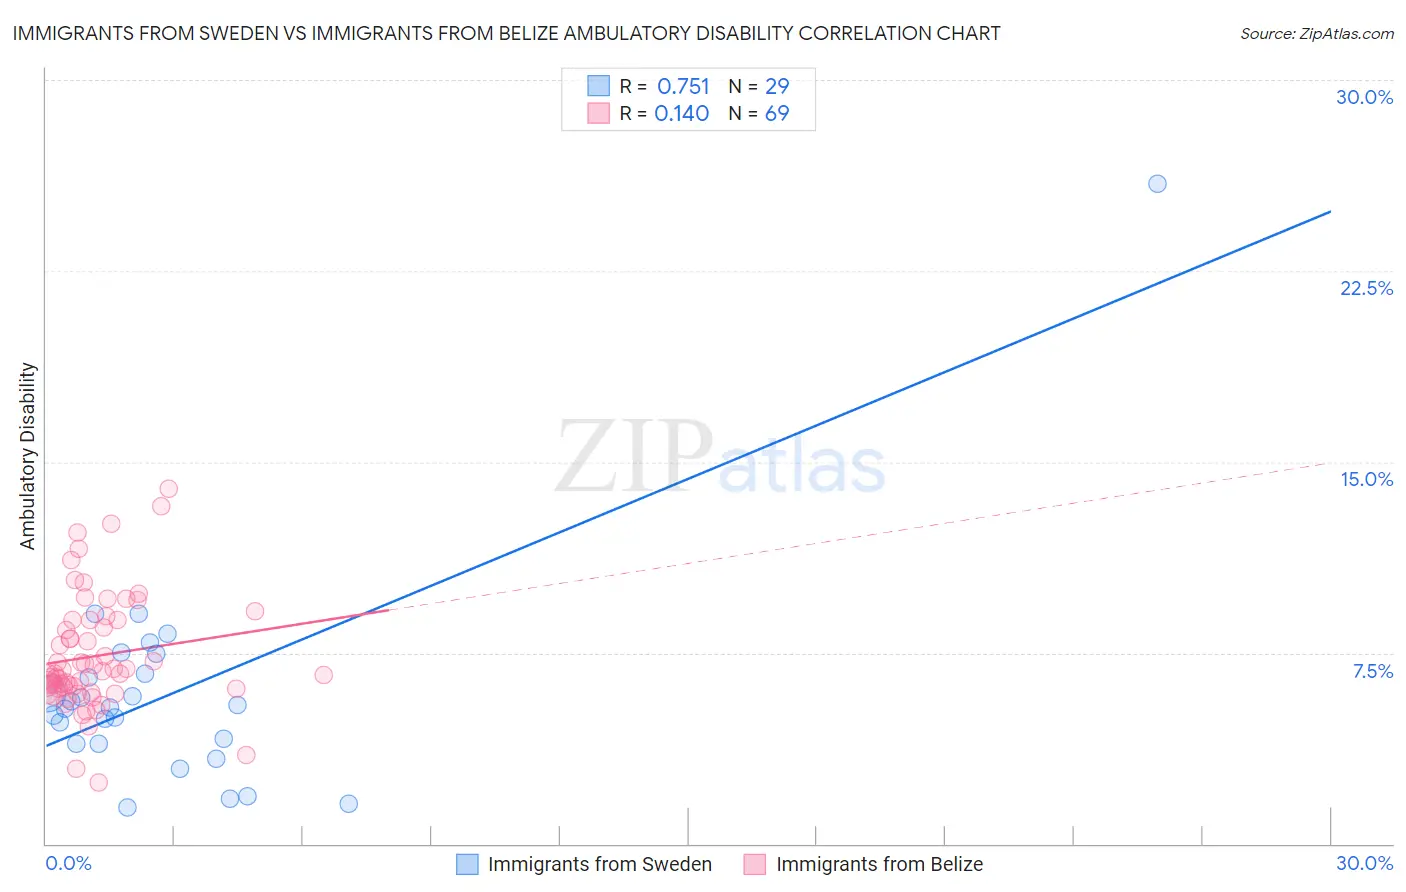
Immigrants from Sweden vs Immigrants from Belize Ambulatory Disability Correlation Chart
The statistical analysis conducted on geographies consisting of 164,722,765 people shows a strong positive correlation between the proportion of Immigrants from Sweden and percentage of population with ambulatory disability in the United States with a correlation coefficient (R) of 0.751 and weighted average of 5.6%. Similarly, the statistical analysis conducted on geographies consisting of 130,290,767 people shows a poor positive correlation between the proportion of Immigrants from Belize and percentage of population with ambulatory disability in the United States with a correlation coefficient (R) of 0.140 and weighted average of 6.6%, a difference of 18.0%.
Ambulatory Disability Correlation Summary
| Measurement | Immigrants from Sweden | Immigrants from Belize |
| Minimum | 1.4% | 2.4% |
| Maximum | 25.9% | 14.0% |
| Range | 24.5% | 11.6% |
| Mean | 5.9% | 7.4% |
| Median | 5.4% | 6.7% |
| Interquartile 25% (IQ1) | 3.9% | 6.1% |
| Interquartile 75% (IQ3) | 7.1% | 8.8% |
| Interquartile Range (IQR) | 3.1% | 2.7% |
| Standard Deviation (Sample) | 4.4% | 2.3% |
| Standard Deviation (Population) | 4.3% | 2.2% |
Similar Demographics by Ambulatory Disability
Demographics Similar to Immigrants from Sweden by Ambulatory Disability
In terms of ambulatory disability, the demographic groups most similar to Immigrants from Sweden are Egyptian (5.6%, a difference of 0.010%), Immigrants from Japan (5.6%, a difference of 0.010%), Immigrants from Argentina (5.6%, a difference of 0.020%), Immigrants from Indonesia (5.5%, a difference of 0.17%), and Bulgarian (5.6%, a difference of 0.22%).
| Demographics | Rating | Rank | Ambulatory Disability |
| Cypriots | 100.0 /100 | #38 | Exceptional 5.5% |
| Immigrants | Eritrea | 100.0 /100 | #39 | Exceptional 5.5% |
| Venezuelans | 99.9 /100 | #40 | Exceptional 5.5% |
| Mongolians | 99.9 /100 | #41 | Exceptional 5.5% |
| Argentineans | 99.9 /100 | #42 | Exceptional 5.5% |
| Paraguayans | 99.9 /100 | #43 | Exceptional 5.5% |
| Immigrants | Indonesia | 99.9 /100 | #44 | Exceptional 5.5% |
| Immigrants | Sweden | 99.9 /100 | #45 | Exceptional 5.6% |
| Egyptians | 99.9 /100 | #46 | Exceptional 5.6% |
| Immigrants | Japan | 99.9 /100 | #47 | Exceptional 5.6% |
| Immigrants | Argentina | 99.9 /100 | #48 | Exceptional 5.6% |
| Bulgarians | 99.9 /100 | #49 | Exceptional 5.6% |
| Luxembourgers | 99.9 /100 | #50 | Exceptional 5.6% |
| Taiwanese | 99.8 /100 | #51 | Exceptional 5.6% |
| Jordanians | 99.8 /100 | #52 | Exceptional 5.6% |
Demographics Similar to Immigrants from Belize by Ambulatory Disability
In terms of ambulatory disability, the demographic groups most similar to Immigrants from Belize are Aleut (6.6%, a difference of 0.010%), Irish (6.6%, a difference of 0.070%), Spanish American Indian (6.5%, a difference of 0.19%), English (6.6%, a difference of 0.24%), and Bermudan (6.5%, a difference of 0.27%).
| Demographics | Rating | Rank | Ambulatory Disability |
| Scottish | 0.7 /100 | #253 | Tragic 6.5% |
| Belizeans | 0.7 /100 | #254 | Tragic 6.5% |
| Welsh | 0.6 /100 | #255 | Tragic 6.5% |
| Immigrants | Uzbekistan | 0.6 /100 | #256 | Tragic 6.5% |
| Bermudans | 0.5 /100 | #257 | Tragic 6.5% |
| Spanish American Indians | 0.5 /100 | #258 | Tragic 6.5% |
| Aleuts | 0.4 /100 | #259 | Tragic 6.6% |
| Immigrants | Belize | 0.4 /100 | #260 | Tragic 6.6% |
| Irish | 0.4 /100 | #261 | Tragic 6.6% |
| English | 0.4 /100 | #262 | Tragic 6.6% |
| Hmong | 0.3 /100 | #263 | Tragic 6.6% |
| Nepalese | 0.2 /100 | #264 | Tragic 6.6% |
| Bahamians | 0.2 /100 | #265 | Tragic 6.6% |
| Guyanese | 0.2 /100 | #266 | Tragic 6.6% |
| Trinidadians and Tobagonians | 0.2 /100 | #267 | Tragic 6.6% |