Fijian vs Immigrants from Ecuador Ambulatory Disability
COMPARE
Fijian
Immigrants from Ecuador
Ambulatory Disability
Ambulatory Disability Comparison
Fijians
Immigrants from Ecuador
6.8%
AMBULATORY DISABILITY
0.0/ 100
METRIC RATING
285th/ 347
METRIC RANK
6.1%
AMBULATORY DISABILITY
53.8/ 100
METRIC RATING
170th/ 347
METRIC RANK
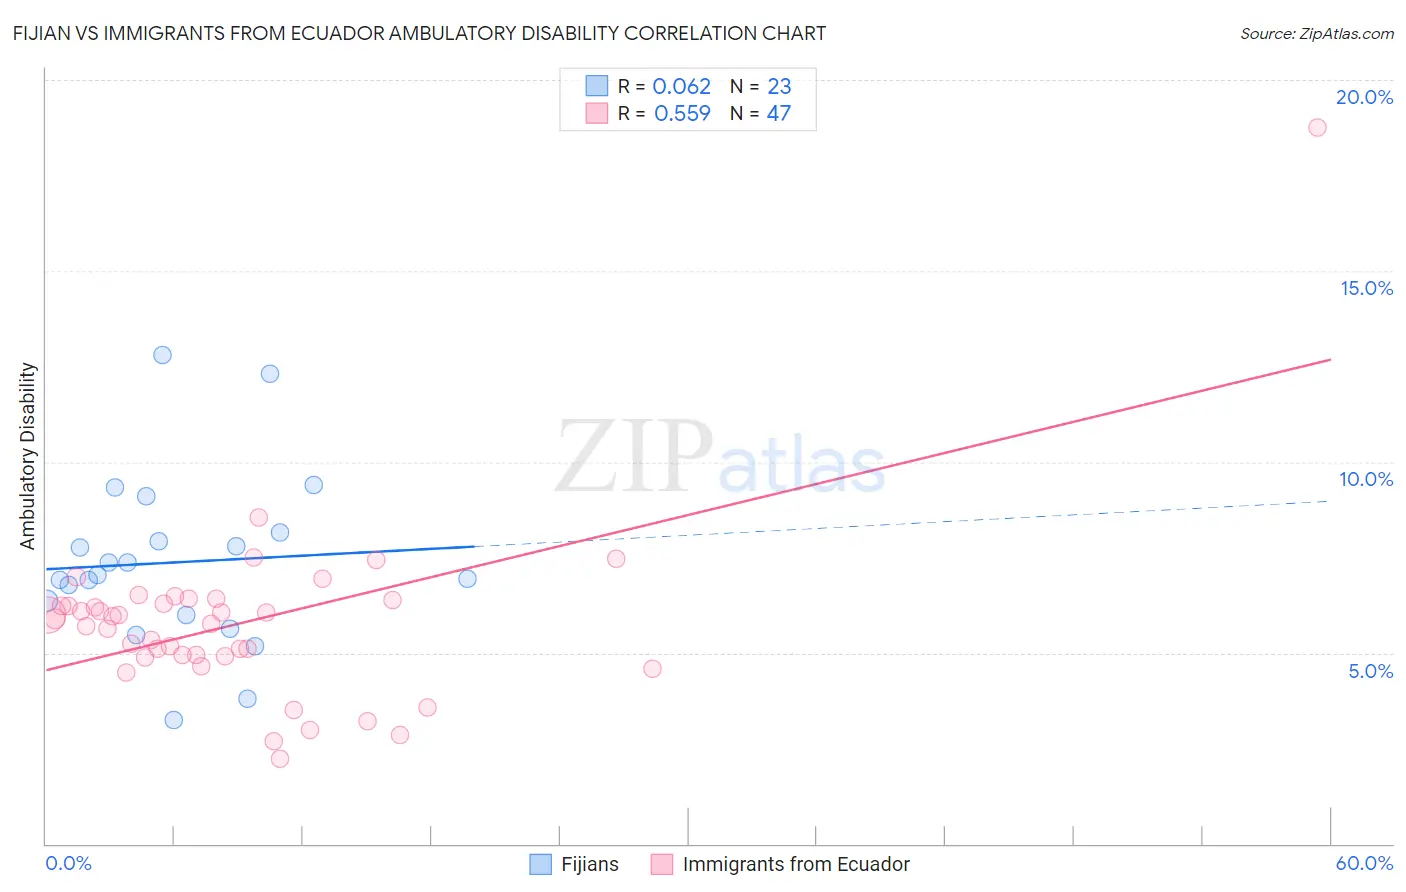
Fijian vs Immigrants from Ecuador Ambulatory Disability Correlation Chart
The statistical analysis conducted on geographies consisting of 55,947,275 people shows a slight positive correlation between the proportion of Fijians and percentage of population with ambulatory disability in the United States with a correlation coefficient (R) of 0.062 and weighted average of 6.8%. Similarly, the statistical analysis conducted on geographies consisting of 270,935,255 people shows a substantial positive correlation between the proportion of Immigrants from Ecuador and percentage of population with ambulatory disability in the United States with a correlation coefficient (R) of 0.559 and weighted average of 6.1%, a difference of 11.5%.
Ambulatory Disability Correlation Summary
| Measurement | Fijian | Immigrants from Ecuador |
| Minimum | 3.2% | 2.2% |
| Maximum | 12.8% | 18.8% |
| Range | 9.6% | 16.5% |
| Mean | 7.4% | 5.8% |
| Median | 7.1% | 5.9% |
| Interquartile 25% (IQ1) | 6.0% | 4.9% |
| Interquartile 75% (IQ3) | 8.2% | 6.4% |
| Interquartile Range (IQR) | 2.2% | 1.5% |
| Standard Deviation (Sample) | 2.3% | 2.4% |
| Standard Deviation (Population) | 2.2% | 2.3% |
Similar Demographics by Ambulatory Disability
Demographics Similar to Fijians by Ambulatory Disability
In terms of ambulatory disability, the demographic groups most similar to Fijians are Yakama (6.8%, a difference of 0.040%), U.S. Virgin Islander (6.8%, a difference of 0.36%), Immigrants from Jamaica (6.8%, a difference of 0.41%), Immigrants from Barbados (6.8%, a difference of 0.48%), and Barbadian (6.8%, a difference of 0.64%).
| Demographics | Rating | Rank | Ambulatory Disability |
| Immigrants | West Indies | 0.1 /100 | #278 | Tragic 6.7% |
| Immigrants | Caribbean | 0.0 /100 | #279 | Tragic 6.7% |
| Pennsylvania Germans | 0.0 /100 | #280 | Tragic 6.8% |
| Yaqui | 0.0 /100 | #281 | Tragic 6.8% |
| Barbadians | 0.0 /100 | #282 | Tragic 6.8% |
| Immigrants | Barbados | 0.0 /100 | #283 | Tragic 6.8% |
| Immigrants | Jamaica | 0.0 /100 | #284 | Tragic 6.8% |
| Fijians | 0.0 /100 | #285 | Tragic 6.8% |
| Yakama | 0.0 /100 | #286 | Tragic 6.8% |
| U.S. Virgin Islanders | 0.0 /100 | #287 | Tragic 6.8% |
| Immigrants | Nonimmigrants | 0.0 /100 | #288 | Tragic 6.9% |
| Immigrants | Dominica | 0.0 /100 | #289 | Tragic 6.9% |
| Scotch-Irish | 0.0 /100 | #290 | Tragic 6.9% |
| West Indians | 0.0 /100 | #291 | Tragic 6.9% |
| Cheyenne | 0.0 /100 | #292 | Tragic 6.9% |
Demographics Similar to Immigrants from Ecuador by Ambulatory Disability
In terms of ambulatory disability, the demographic groups most similar to Immigrants from Ecuador are Moroccan (6.1%, a difference of 0.070%), Immigrants from Burma/Myanmar (6.1%, a difference of 0.090%), Croatian (6.1%, a difference of 0.14%), Immigrants from Canada (6.1%, a difference of 0.20%), and Immigrants from Southern Europe (6.1%, a difference of 0.23%).
| Demographics | Rating | Rank | Ambulatory Disability |
| Lebanese | 66.2 /100 | #163 | Good 6.1% |
| Basques | 63.7 /100 | #164 | Good 6.1% |
| Nicaraguans | 63.2 /100 | #165 | Good 6.1% |
| Iraqis | 62.8 /100 | #166 | Good 6.1% |
| Immigrants | Oceania | 60.7 /100 | #167 | Good 6.1% |
| Ecuadorians | 60.5 /100 | #168 | Good 6.1% |
| Immigrants | Southern Europe | 58.1 /100 | #169 | Average 6.1% |
| Immigrants | Ecuador | 53.8 /100 | #170 | Average 6.1% |
| Moroccans | 52.6 /100 | #171 | Average 6.1% |
| Immigrants | Burma/Myanmar | 52.2 /100 | #172 | Average 6.1% |
| Croatians | 51.2 /100 | #173 | Average 6.1% |
| Immigrants | Canada | 50.0 /100 | #174 | Average 6.1% |
| Vietnamese | 47.2 /100 | #175 | Average 6.1% |
| Immigrants | North America | 45.6 /100 | #176 | Average 6.1% |
| Immigrants | England | 45.4 /100 | #177 | Average 6.1% |