Fijian vs Jamaican Ambulatory Disability
COMPARE
Fijian
Jamaican
Ambulatory Disability
Ambulatory Disability Comparison
Fijians
Jamaicans
6.8%
AMBULATORY DISABILITY
0.0/ 100
METRIC RATING
285th/ 347
METRIC RANK
6.7%
AMBULATORY DISABILITY
0.1/ 100
METRIC RATING
277th/ 347
METRIC RANK
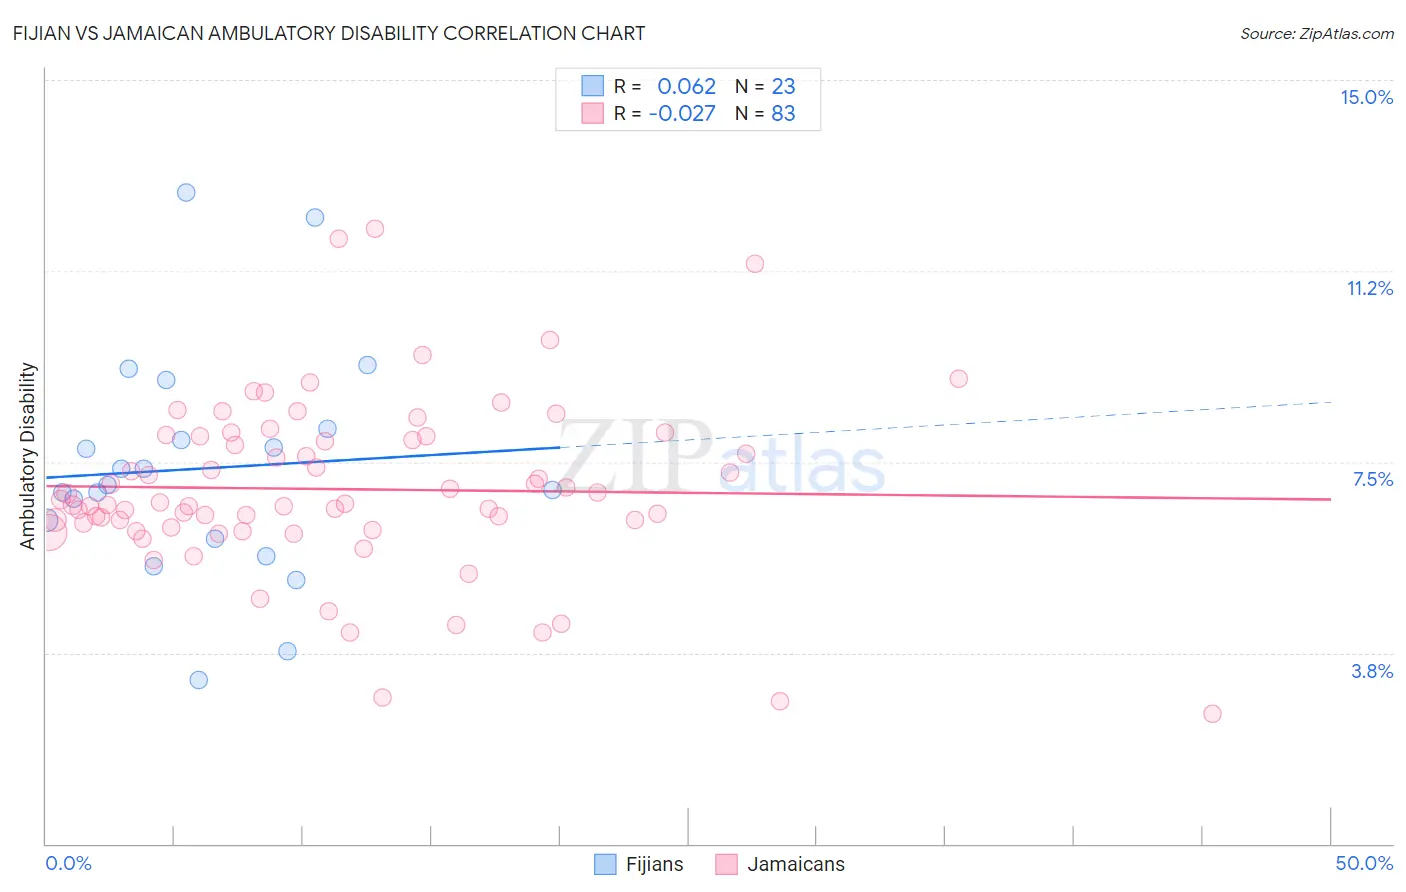
Fijian vs Jamaican Ambulatory Disability Correlation Chart
The statistical analysis conducted on geographies consisting of 55,947,275 people shows a slight positive correlation between the proportion of Fijians and percentage of population with ambulatory disability in the United States with a correlation coefficient (R) of 0.062 and weighted average of 6.8%. Similarly, the statistical analysis conducted on geographies consisting of 367,821,612 people shows no correlation between the proportion of Jamaicans and percentage of population with ambulatory disability in the United States with a correlation coefficient (R) of -0.027 and weighted average of 6.7%, a difference of 1.3%.
Ambulatory Disability Correlation Summary
| Measurement | Fijian | Jamaican |
| Minimum | 3.2% | 2.5% |
| Maximum | 12.8% | 12.1% |
| Range | 9.6% | 9.5% |
| Mean | 7.4% | 7.0% |
| Median | 7.1% | 6.7% |
| Interquartile 25% (IQ1) | 6.0% | 6.2% |
| Interquartile 75% (IQ3) | 8.2% | 8.0% |
| Interquartile Range (IQR) | 2.2% | 1.8% |
| Standard Deviation (Sample) | 2.3% | 1.7% |
| Standard Deviation (Population) | 2.2% | 1.7% |
Demographics Similar to Fijians and Jamaicans by Ambulatory Disability
In terms of ambulatory disability, the demographic groups most similar to Fijians are Yakama (6.8%, a difference of 0.040%), U.S. Virgin Islander (6.8%, a difference of 0.36%), Immigrants from Jamaica (6.8%, a difference of 0.41%), Immigrants from Barbados (6.8%, a difference of 0.48%), and Barbadian (6.8%, a difference of 0.64%). Similarly, the demographic groups most similar to Jamaicans are Celtic (6.7%, a difference of 0.080%), Immigrants from West Indies (6.7%, a difference of 0.080%), Immigrants from Guyana (6.7%, a difference of 0.11%), Sioux (6.7%, a difference of 0.17%), and Immigrants from Caribbean (6.7%, a difference of 0.39%).
| Demographics | Rating | Rank | Ambulatory Disability |
| Immigrants | Trinidad and Tobago | 0.1 /100 | #271 | Tragic 6.7% |
| French Canadians | 0.1 /100 | #272 | Tragic 6.7% |
| Whites/Caucasians | 0.1 /100 | #273 | Tragic 6.7% |
| Sioux | 0.1 /100 | #274 | Tragic 6.7% |
| Immigrants | Guyana | 0.1 /100 | #275 | Tragic 6.7% |
| Celtics | 0.1 /100 | #276 | Tragic 6.7% |
| Jamaicans | 0.1 /100 | #277 | Tragic 6.7% |
| Immigrants | West Indies | 0.1 /100 | #278 | Tragic 6.7% |
| Immigrants | Caribbean | 0.0 /100 | #279 | Tragic 6.7% |
| Pennsylvania Germans | 0.0 /100 | #280 | Tragic 6.8% |
| Yaqui | 0.0 /100 | #281 | Tragic 6.8% |
| Barbadians | 0.0 /100 | #282 | Tragic 6.8% |
| Immigrants | Barbados | 0.0 /100 | #283 | Tragic 6.8% |
| Immigrants | Jamaica | 0.0 /100 | #284 | Tragic 6.8% |
| Fijians | 0.0 /100 | #285 | Tragic 6.8% |
| Yakama | 0.0 /100 | #286 | Tragic 6.8% |
| U.S. Virgin Islanders | 0.0 /100 | #287 | Tragic 6.8% |
| Immigrants | Nonimmigrants | 0.0 /100 | #288 | Tragic 6.9% |
| Immigrants | Dominica | 0.0 /100 | #289 | Tragic 6.9% |
| Scotch-Irish | 0.0 /100 | #290 | Tragic 6.9% |
| West Indians | 0.0 /100 | #291 | Tragic 6.9% |