Fijian vs Ugandan 4 or more Vehicles in Household
COMPARE
Fijian
Ugandan
4 or more Vehicles in Household
4 or more Vehicles in Household Comparison
Fijians
Ugandans
7.8%
4 OR MORE VEHICLES IN HOUSEHOLD
100.0/ 100
METRIC RATING
43rd/ 347
METRIC RANK
5.7%
4 OR MORE VEHICLES IN HOUSEHOLD
2.2/ 100
METRIC RATING
251st/ 347
METRIC RANK
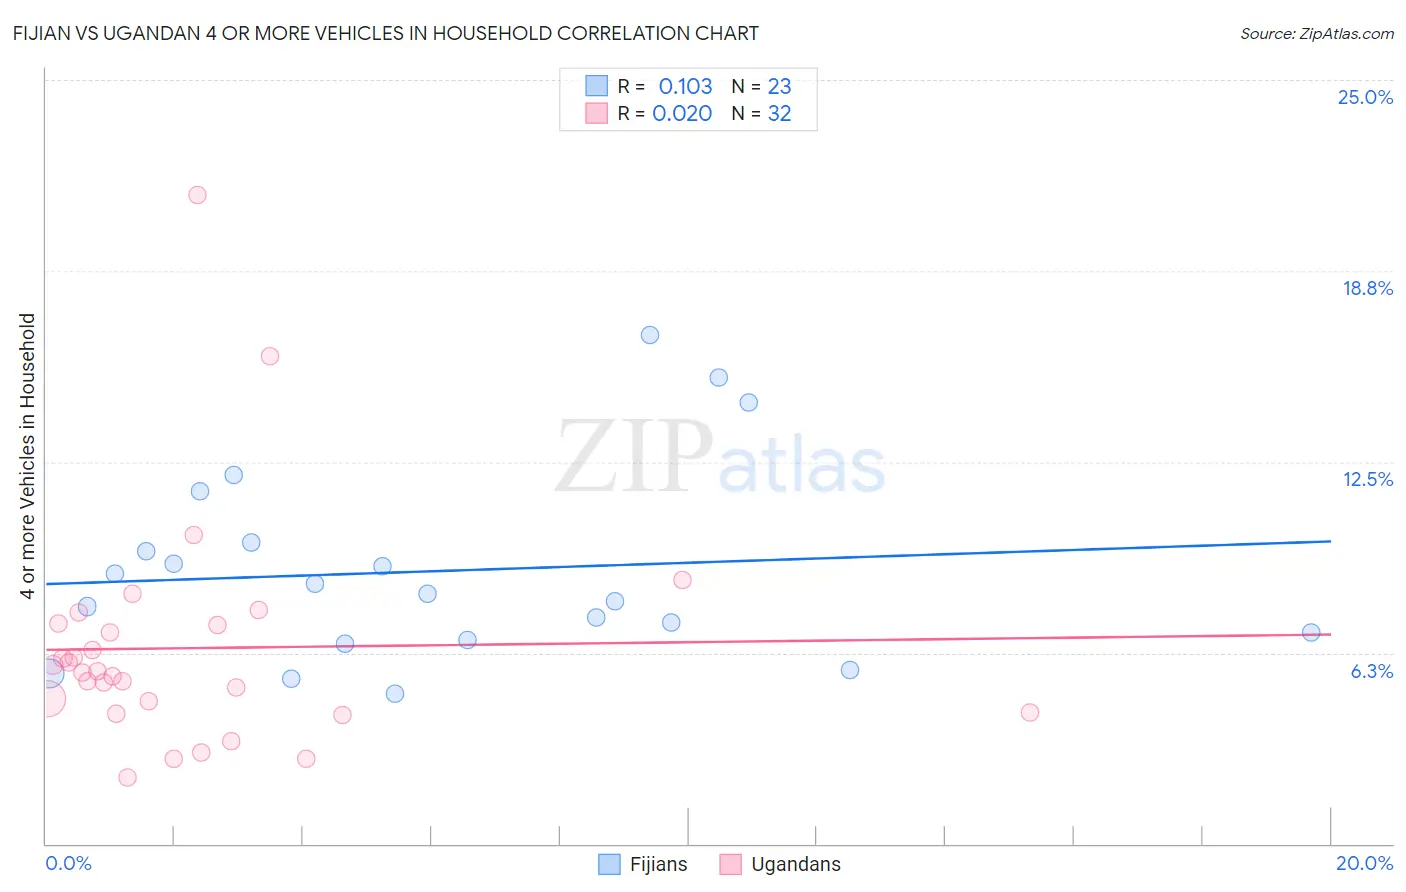
Fijian vs Ugandan 4 or more Vehicles in Household Correlation Chart
The statistical analysis conducted on geographies consisting of 55,944,814 people shows a poor positive correlation between the proportion of Fijians and percentage of households with 4 or more vehicles available in the United States with a correlation coefficient (R) of 0.103 and weighted average of 7.8%. Similarly, the statistical analysis conducted on geographies consisting of 93,911,160 people shows no correlation between the proportion of Ugandans and percentage of households with 4 or more vehicles available in the United States with a correlation coefficient (R) of 0.020 and weighted average of 5.7%, a difference of 36.7%.
4 or more Vehicles in Household Correlation Summary
| Measurement | Fijian | Ugandan |
| Minimum | 4.9% | 2.2% |
| Maximum | 16.7% | 21.2% |
| Range | 11.7% | 19.1% |
| Mean | 8.9% | 6.4% |
| Median | 8.2% | 5.6% |
| Interquartile 25% (IQ1) | 6.7% | 4.5% |
| Interquartile 75% (IQ3) | 9.9% | 7.2% |
| Interquartile Range (IQR) | 3.2% | 2.7% |
| Standard Deviation (Sample) | 3.2% | 3.7% |
| Standard Deviation (Population) | 3.1% | 3.7% |
Similar Demographics by 4 or more Vehicles in Household
Demographics Similar to Fijians by 4 or more Vehicles in Household
In terms of 4 or more vehicles in household, the demographic groups most similar to Fijians are Salvadoran (7.8%, a difference of 0.11%), Bhutanese (7.8%, a difference of 0.26%), Choctaw (7.8%, a difference of 0.31%), Crow (7.8%, a difference of 0.49%), and Pima (7.9%, a difference of 0.60%).
| Demographics | Rating | Rank | 4 or more Vehicles in Household |
| Norwegians | 100.0 /100 | #36 | Exceptional 8.0% |
| Scandinavians | 100.0 /100 | #37 | Exceptional 8.0% |
| Sioux | 100.0 /100 | #38 | Exceptional 8.0% |
| Spanish Americans | 100.0 /100 | #39 | Exceptional 8.0% |
| Spanish | 100.0 /100 | #40 | Exceptional 7.9% |
| Pima | 100.0 /100 | #41 | Exceptional 7.9% |
| Salvadorans | 100.0 /100 | #42 | Exceptional 7.8% |
| Fijians | 100.0 /100 | #43 | Exceptional 7.8% |
| Bhutanese | 100.0 /100 | #44 | Exceptional 7.8% |
| Choctaw | 100.0 /100 | #45 | Exceptional 7.8% |
| Crow | 100.0 /100 | #46 | Exceptional 7.8% |
| Osage | 100.0 /100 | #47 | Exceptional 7.8% |
| Swiss | 100.0 /100 | #48 | Exceptional 7.8% |
| Cherokee | 100.0 /100 | #49 | Exceptional 7.7% |
| Immigrants | El Salvador | 100.0 /100 | #50 | Exceptional 7.7% |
Demographics Similar to Ugandans by 4 or more Vehicles in Household
In terms of 4 or more vehicles in household, the demographic groups most similar to Ugandans are Immigrants from Europe (5.7%, a difference of 0.020%), Immigrants from Southern Europe (5.7%, a difference of 0.12%), Immigrants from Eastern Africa (5.7%, a difference of 0.14%), Subsaharan African (5.7%, a difference of 0.23%), and Immigrants from Ethiopia (5.7%, a difference of 0.25%).
| Demographics | Rating | Rank | 4 or more Vehicles in Household |
| Ethiopians | 3.2 /100 | #244 | Tragic 5.8% |
| Bulgarians | 3.1 /100 | #245 | Tragic 5.8% |
| Immigrants | North Macedonia | 2.5 /100 | #246 | Tragic 5.7% |
| Immigrants | Ethiopia | 2.4 /100 | #247 | Tragic 5.7% |
| Immigrants | Eastern Africa | 2.4 /100 | #248 | Tragic 5.7% |
| Immigrants | Southern Europe | 2.3 /100 | #249 | Tragic 5.7% |
| Immigrants | Europe | 2.3 /100 | #250 | Tragic 5.7% |
| Ugandans | 2.2 /100 | #251 | Tragic 5.7% |
| Sub-Saharan Africans | 2.1 /100 | #252 | Tragic 5.7% |
| Immigrants | Cuba | 1.6 /100 | #253 | Tragic 5.7% |
| Immigrants | Panama | 1.5 /100 | #254 | Tragic 5.7% |
| Yup'ik | 1.5 /100 | #255 | Tragic 5.7% |
| Immigrants | Turkey | 1.5 /100 | #256 | Tragic 5.7% |
| Immigrants | Northern Africa | 1.4 /100 | #257 | Tragic 5.6% |
| Immigrants | Lithuania | 1.4 /100 | #258 | Tragic 5.6% |