Fijian vs Immigrants from South Central Asia Disability Age Under 5
COMPARE
Fijian
Immigrants from South Central Asia
Disability Age Under 5
Disability Age Under 5 Comparison
Fijians
Immigrants from South Central Asia
1.2%
DISABILITY AGE UNDER 5
84.7/ 100
METRIC RATING
135th/ 347
METRIC RANK
1.0%
DISABILITY AGE UNDER 5
99.9/ 100
METRIC RATING
30th/ 347
METRIC RANK
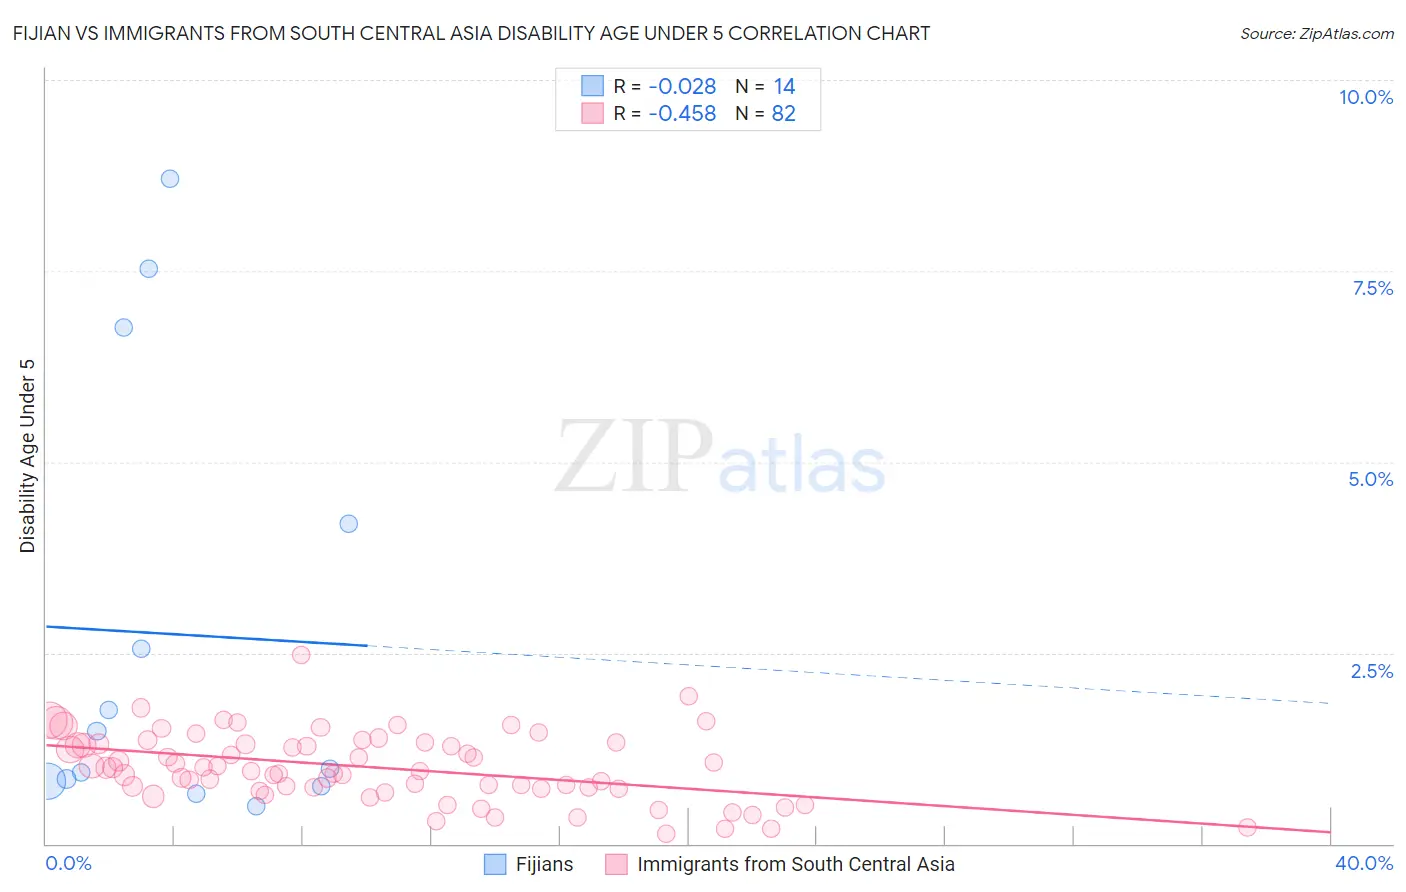
Fijian vs Immigrants from South Central Asia Disability Age Under 5 Correlation Chart
The statistical analysis conducted on geographies consisting of 45,950,279 people shows no correlation between the proportion of Fijians and percentage of population with a disability under the age of 5 in the United States with a correlation coefficient (R) of -0.028 and weighted average of 1.2%. Similarly, the statistical analysis conducted on geographies consisting of 240,701,404 people shows a moderate negative correlation between the proportion of Immigrants from South Central Asia and percentage of population with a disability under the age of 5 in the United States with a correlation coefficient (R) of -0.458 and weighted average of 1.0%, a difference of 16.0%.
Disability Age Under 5 Correlation Summary
| Measurement | Fijian | Immigrants from South Central Asia |
| Minimum | 0.50% | 0.13% |
| Maximum | 8.7% | 2.5% |
| Range | 8.2% | 2.3% |
| Mean | 2.7% | 1.0% |
| Median | 1.2% | 0.97% |
| Interquartile 25% (IQ1) | 0.81% | 0.72% |
| Interquartile 75% (IQ3) | 4.2% | 1.3% |
| Interquartile Range (IQR) | 3.4% | 0.59% |
| Standard Deviation (Sample) | 2.9% | 0.45% |
| Standard Deviation (Population) | 2.8% | 0.44% |
Similar Demographics by Disability Age Under 5
Demographics Similar to Fijians by Disability Age Under 5
In terms of disability age under 5, the demographic groups most similar to Fijians are Moroccan (1.2%, a difference of 0.18%), Argentinean (1.2%, a difference of 0.20%), Immigrants from Eastern Africa (1.2%, a difference of 0.27%), Immigrants from Czechoslovakia (1.2%, a difference of 0.32%), and Immigrants from Spain (1.2%, a difference of 0.36%).
| Demographics | Rating | Rank | Disability Age Under 5 |
| Immigrants | France | 88.4 /100 | #128 | Excellent 1.2% |
| Immigrants | Immigrants | 88.0 /100 | #129 | Excellent 1.2% |
| Koreans | 87.7 /100 | #130 | Excellent 1.2% |
| Immigrants | Serbia | 87.6 /100 | #131 | Excellent 1.2% |
| Immigrants | Eastern Europe | 87.3 /100 | #132 | Excellent 1.2% |
| Immigrants | Spain | 86.5 /100 | #133 | Excellent 1.2% |
| Argentineans | 85.7 /100 | #134 | Excellent 1.2% |
| Fijians | 84.7 /100 | #135 | Excellent 1.2% |
| Moroccans | 83.6 /100 | #136 | Excellent 1.2% |
| Immigrants | Eastern Africa | 83.1 /100 | #137 | Excellent 1.2% |
| Immigrants | Czechoslovakia | 82.8 /100 | #138 | Excellent 1.2% |
| New Zealanders | 81.4 /100 | #139 | Excellent 1.2% |
| Somalis | 80.8 /100 | #140 | Excellent 1.2% |
| Immigrants | Honduras | 80.4 /100 | #141 | Excellent 1.2% |
| Immigrants | Colombia | 79.3 /100 | #142 | Good 1.2% |
Demographics Similar to Immigrants from South Central Asia by Disability Age Under 5
In terms of disability age under 5, the demographic groups most similar to Immigrants from South Central Asia are Armenian (1.0%, a difference of 0.28%), Iranian (1.0%, a difference of 0.33%), Bolivian (1.0%, a difference of 0.51%), Immigrants from Belarus (1.0%, a difference of 0.52%), and Immigrants from Ukraine (1.0%, a difference of 0.63%).
| Demographics | Rating | Rank | Disability Age Under 5 |
| Yakama | 100.0 /100 | #23 | Exceptional 1.00% |
| Indians (Asian) | 100.0 /100 | #24 | Exceptional 1.0% |
| Immigrants | Micronesia | 100.0 /100 | #25 | Exceptional 1.0% |
| Immigrants | Taiwan | 100.0 /100 | #26 | Exceptional 1.0% |
| Guyanese | 100.0 /100 | #27 | Exceptional 1.0% |
| Immigrants | Eastern Asia | 100.0 /100 | #28 | Exceptional 1.0% |
| Immigrants | Belarus | 100.0 /100 | #29 | Exceptional 1.0% |
| Immigrants | South Central Asia | 99.9 /100 | #30 | Exceptional 1.0% |
| Armenians | 99.9 /100 | #31 | Exceptional 1.0% |
| Iranians | 99.9 /100 | #32 | Exceptional 1.0% |
| Bolivians | 99.9 /100 | #33 | Exceptional 1.0% |
| Immigrants | Ukraine | 99.9 /100 | #34 | Exceptional 1.0% |
| Barbadians | 99.9 /100 | #35 | Exceptional 1.0% |
| Immigrants | Nepal | 99.9 /100 | #36 | Exceptional 1.0% |
| Immigrants | India | 99.9 /100 | #37 | Exceptional 1.0% |