Fijian vs Immigrants from Sri Lanka Disability Age Under 5
COMPARE
Fijian
Immigrants from Sri Lanka
Disability Age Under 5
Disability Age Under 5 Comparison
Fijians
Immigrants from Sri Lanka
1.2%
DISABILITY AGE UNDER 5
84.7/ 100
METRIC RATING
135th/ 347
METRIC RANK
1.1%
DISABILITY AGE UNDER 5
98.5/ 100
METRIC RATING
73rd/ 347
METRIC RANK
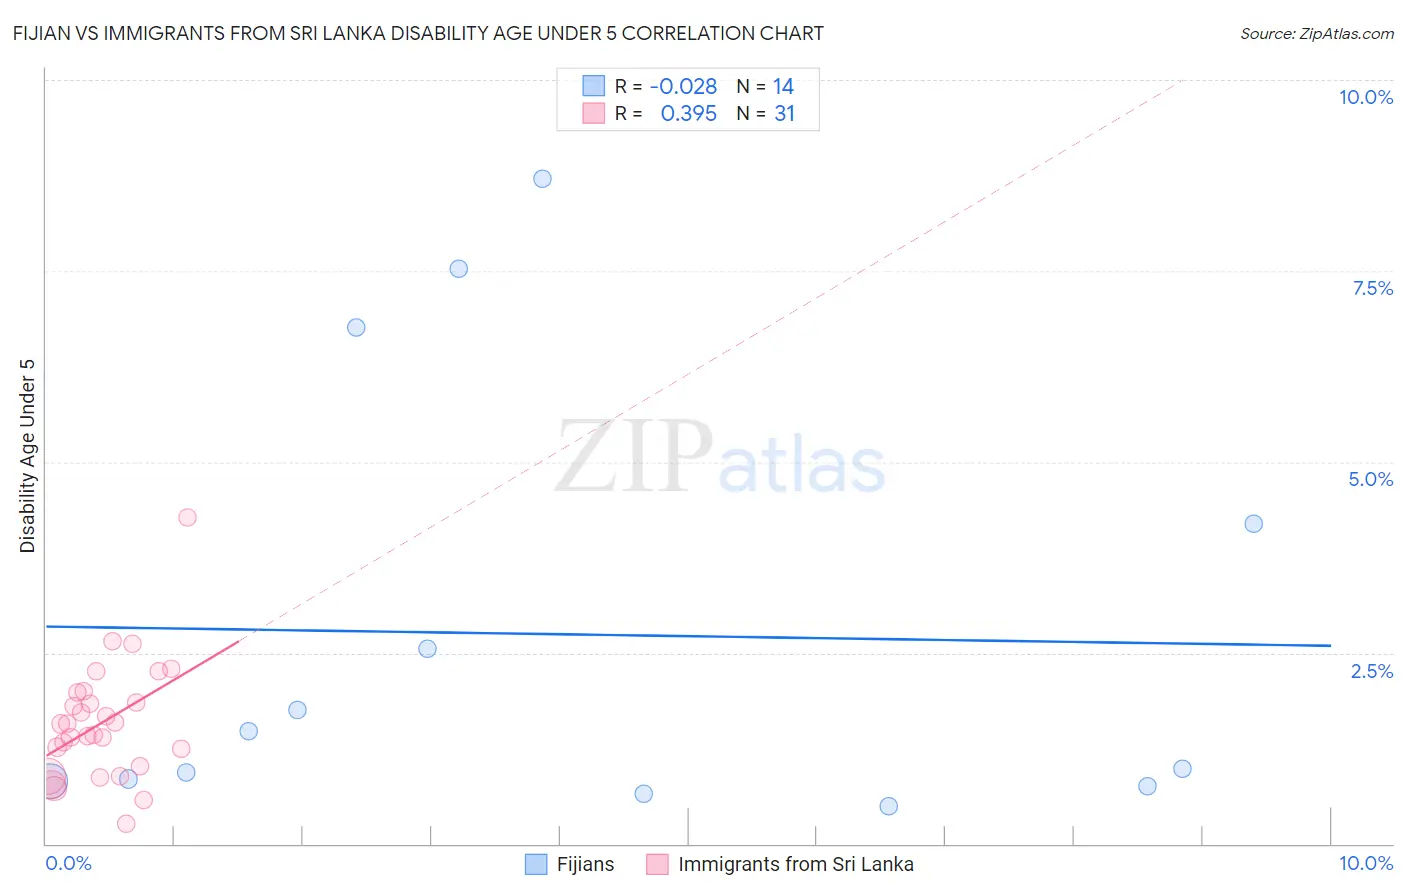
Fijian vs Immigrants from Sri Lanka Disability Age Under 5 Correlation Chart
The statistical analysis conducted on geographies consisting of 45,950,279 people shows no correlation between the proportion of Fijians and percentage of population with a disability under the age of 5 in the United States with a correlation coefficient (R) of -0.028 and weighted average of 1.2%. Similarly, the statistical analysis conducted on geographies consisting of 104,720,204 people shows a mild positive correlation between the proportion of Immigrants from Sri Lanka and percentage of population with a disability under the age of 5 in the United States with a correlation coefficient (R) of 0.395 and weighted average of 1.1%, a difference of 6.1%.
Disability Age Under 5 Correlation Summary
| Measurement | Fijian | Immigrants from Sri Lanka |
| Minimum | 0.50% | 0.25% |
| Maximum | 8.7% | 4.3% |
| Range | 8.2% | 4.0% |
| Mean | 2.7% | 1.6% |
| Median | 1.2% | 1.6% |
| Interquartile 25% (IQ1) | 0.81% | 1.0% |
| Interquartile 75% (IQ3) | 4.2% | 2.0% |
| Interquartile Range (IQR) | 3.4% | 0.97% |
| Standard Deviation (Sample) | 2.9% | 0.77% |
| Standard Deviation (Population) | 2.8% | 0.76% |
Similar Demographics by Disability Age Under 5
Demographics Similar to Fijians by Disability Age Under 5
In terms of disability age under 5, the demographic groups most similar to Fijians are Moroccan (1.2%, a difference of 0.18%), Argentinean (1.2%, a difference of 0.20%), Immigrants from Eastern Africa (1.2%, a difference of 0.27%), Immigrants from Czechoslovakia (1.2%, a difference of 0.32%), and Immigrants from Spain (1.2%, a difference of 0.36%).
| Demographics | Rating | Rank | Disability Age Under 5 |
| Immigrants | France | 88.4 /100 | #128 | Excellent 1.2% |
| Immigrants | Immigrants | 88.0 /100 | #129 | Excellent 1.2% |
| Koreans | 87.7 /100 | #130 | Excellent 1.2% |
| Immigrants | Serbia | 87.6 /100 | #131 | Excellent 1.2% |
| Immigrants | Eastern Europe | 87.3 /100 | #132 | Excellent 1.2% |
| Immigrants | Spain | 86.5 /100 | #133 | Excellent 1.2% |
| Argentineans | 85.7 /100 | #134 | Excellent 1.2% |
| Fijians | 84.7 /100 | #135 | Excellent 1.2% |
| Moroccans | 83.6 /100 | #136 | Excellent 1.2% |
| Immigrants | Eastern Africa | 83.1 /100 | #137 | Excellent 1.2% |
| Immigrants | Czechoslovakia | 82.8 /100 | #138 | Excellent 1.2% |
| New Zealanders | 81.4 /100 | #139 | Excellent 1.2% |
| Somalis | 80.8 /100 | #140 | Excellent 1.2% |
| Immigrants | Honduras | 80.4 /100 | #141 | Excellent 1.2% |
| Immigrants | Colombia | 79.3 /100 | #142 | Good 1.2% |
Demographics Similar to Immigrants from Sri Lanka by Disability Age Under 5
In terms of disability age under 5, the demographic groups most similar to Immigrants from Sri Lanka are Jordanian (1.1%, a difference of 0.0%), Burmese (1.1%, a difference of 0.080%), Immigrants from Pakistan (1.1%, a difference of 0.090%), Trinidadian and Tobagonian (1.1%, a difference of 0.24%), and Immigrants from Ecuador (1.1%, a difference of 0.30%).
| Demographics | Rating | Rank | Disability Age Under 5 |
| Immigrants | Indonesia | 98.7 /100 | #66 | Exceptional 1.1% |
| Immigrants | Belize | 98.7 /100 | #67 | Exceptional 1.1% |
| South Africans | 98.7 /100 | #68 | Exceptional 1.1% |
| Israelis | 98.7 /100 | #69 | Exceptional 1.1% |
| Immigrants | Ecuador | 98.6 /100 | #70 | Exceptional 1.1% |
| Trinidadians and Tobagonians | 98.6 /100 | #71 | Exceptional 1.1% |
| Burmese | 98.5 /100 | #72 | Exceptional 1.1% |
| Immigrants | Sri Lanka | 98.5 /100 | #73 | Exceptional 1.1% |
| Jordanians | 98.5 /100 | #74 | Exceptional 1.1% |
| Immigrants | Pakistan | 98.4 /100 | #75 | Exceptional 1.1% |
| Immigrants | Burma/Myanmar | 98.2 /100 | #76 | Exceptional 1.1% |
| Immigrants | Denmark | 98.1 /100 | #77 | Exceptional 1.1% |
| West Indians | 98.0 /100 | #78 | Exceptional 1.1% |
| Hmong | 98.0 /100 | #79 | Exceptional 1.1% |
| Immigrants | Trinidad and Tobago | 98.0 /100 | #80 | Exceptional 1.1% |