Fijian vs Inupiat Unemployment
COMPARE
Fijian
Inupiat
Unemployment
Unemployment Comparison
Fijians
Inupiat
5.0%
UNEMPLOYMENT
97.6/ 100
METRIC RATING
82nd/ 347
METRIC RANK
10.1%
UNEMPLOYMENT
0.0/ 100
METRIC RATING
345th/ 347
METRIC RANK
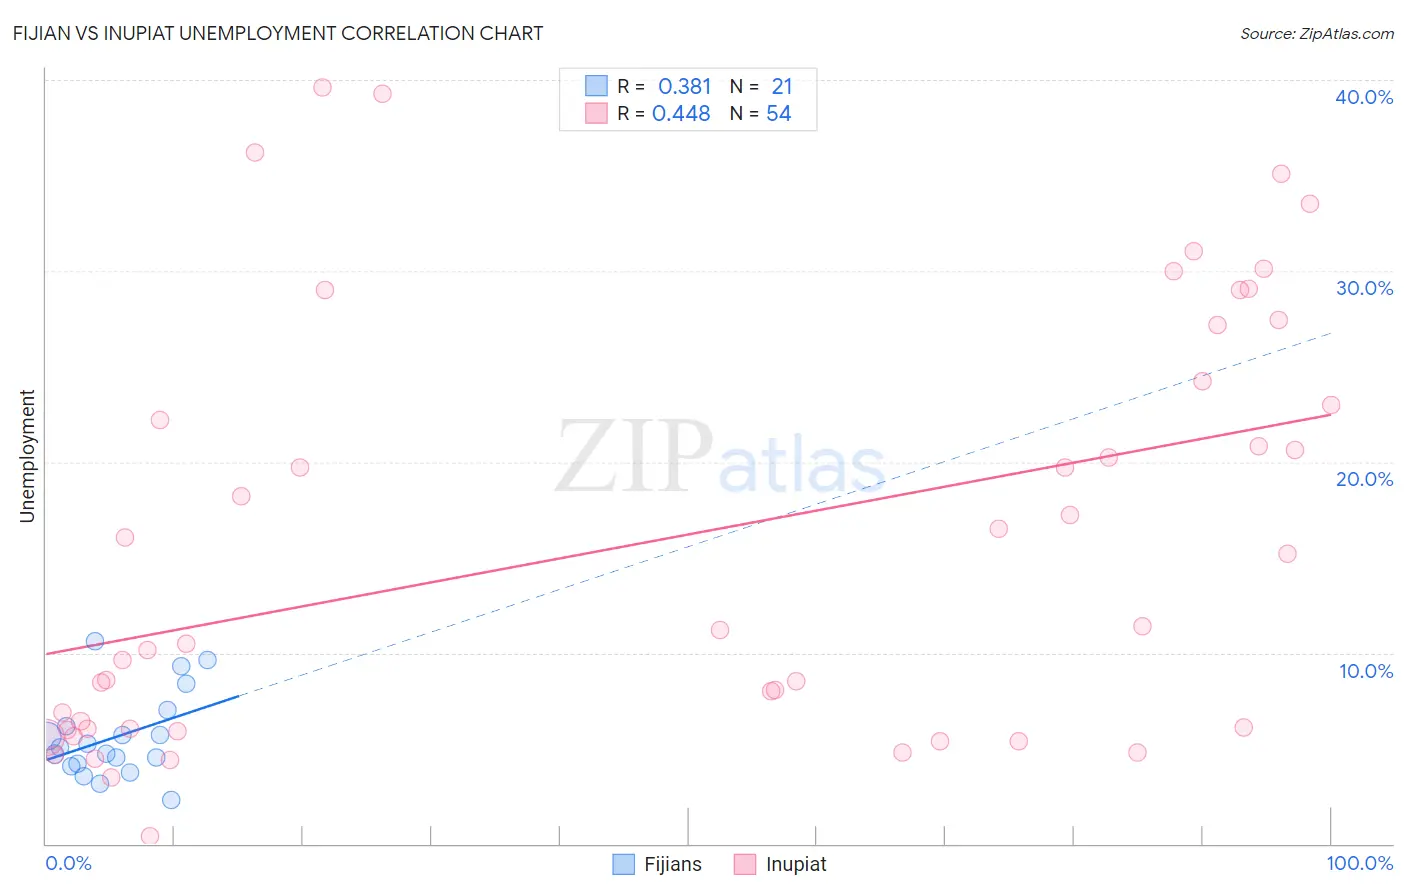
Fijian vs Inupiat Unemployment Correlation Chart
The statistical analysis conducted on geographies consisting of 55,931,908 people shows a mild positive correlation between the proportion of Fijians and unemployment in the United States with a correlation coefficient (R) of 0.381 and weighted average of 5.0%. Similarly, the statistical analysis conducted on geographies consisting of 96,296,891 people shows a moderate positive correlation between the proportion of Inupiat and unemployment in the United States with a correlation coefficient (R) of 0.448 and weighted average of 10.1%, a difference of 103.9%.
Unemployment Correlation Summary
| Measurement | Fijian | Inupiat |
| Minimum | 2.3% | 0.40% |
| Maximum | 10.6% | 39.6% |
| Range | 8.3% | 39.2% |
| Mean | 5.6% | 15.9% |
| Median | 5.1% | 11.3% |
| Interquartile 25% (IQ1) | 4.1% | 6.0% |
| Interquartile 75% (IQ3) | 6.6% | 24.2% |
| Interquartile Range (IQR) | 2.4% | 18.2% |
| Standard Deviation (Sample) | 2.2% | 11.0% |
| Standard Deviation (Population) | 2.2% | 10.9% |
Similar Demographics by Unemployment
Demographics Similar to Fijians by Unemployment
In terms of unemployment, the demographic groups most similar to Fijians are Basque (5.0%, a difference of 0.010%), Hmong (5.0%, a difference of 0.010%), Immigrants from Sweden (5.0%, a difference of 0.020%), Canadian (5.0%, a difference of 0.090%), and Russian (5.0%, a difference of 0.090%).
| Demographics | Rating | Rank | Unemployment |
| Turks | 98.0 /100 | #75 | Exceptional 4.9% |
| German Russians | 98.0 /100 | #76 | Exceptional 4.9% |
| Cypriots | 97.9 /100 | #77 | Exceptional 4.9% |
| Okinawans | 97.9 /100 | #78 | Exceptional 4.9% |
| Canadians | 97.7 /100 | #79 | Exceptional 5.0% |
| Immigrants | Sweden | 97.6 /100 | #80 | Exceptional 5.0% |
| Basques | 97.6 /100 | #81 | Exceptional 5.0% |
| Fijians | 97.6 /100 | #82 | Exceptional 5.0% |
| Hmong | 97.6 /100 | #83 | Exceptional 5.0% |
| Russians | 97.4 /100 | #84 | Exceptional 5.0% |
| Immigrants | Australia | 97.0 /100 | #85 | Exceptional 5.0% |
| Hungarians | 96.9 /100 | #86 | Exceptional 5.0% |
| Immigrants | Moldova | 96.6 /100 | #87 | Exceptional 5.0% |
| Immigrants | Korea | 96.6 /100 | #88 | Exceptional 5.0% |
| Jordanians | 96.4 /100 | #89 | Exceptional 5.0% |
Demographics Similar to Inupiat by Unemployment
In terms of unemployment, the demographic groups most similar to Inupiat are Arapaho (9.8%, a difference of 2.9%), Crow (11.1%, a difference of 9.4%), Yuman (9.1%, a difference of 11.6%), Hopi (8.9%, a difference of 13.5%), and Tohono O'odham (8.9%, a difference of 14.0%).
| Demographics | Rating | Rank | Unemployment |
| Immigrants | Dominican Republic | 0.0 /100 | #333 | Tragic 7.4% |
| Apache | 0.0 /100 | #334 | Tragic 7.4% |
| Alaskan Athabascans | 0.0 /100 | #335 | Tragic 7.7% |
| Immigrants | Yemen | 0.0 /100 | #336 | Tragic 7.7% |
| Cheyenne | 0.0 /100 | #337 | Tragic 8.0% |
| Pima | 0.0 /100 | #338 | Tragic 8.2% |
| Navajo | 0.0 /100 | #339 | Tragic 8.4% |
| Puerto Ricans | 0.0 /100 | #340 | Tragic 8.4% |
| Tohono O'odham | 0.0 /100 | #341 | Tragic 8.9% |
| Hopi | 0.0 /100 | #342 | Tragic 8.9% |
| Yuman | 0.0 /100 | #343 | Tragic 9.1% |
| Arapaho | 0.0 /100 | #344 | Tragic 9.8% |
| Inupiat | 0.0 /100 | #345 | Tragic 10.1% |
| Crow | 0.0 /100 | #346 | Tragic 11.1% |
| Yup'ik | 0.0 /100 | #347 | Tragic 13.6% |