Fijian vs Immigrants from Nigeria Disability Age Under 5
COMPARE
Fijian
Immigrants from Nigeria
Disability Age Under 5
Disability Age Under 5 Comparison
Fijians
Immigrants from Nigeria
1.2%
DISABILITY AGE UNDER 5
84.7/ 100
METRIC RATING
135th/ 347
METRIC RANK
1.2%
DISABILITY AGE UNDER 5
50.0/ 100
METRIC RATING
175th/ 347
METRIC RANK
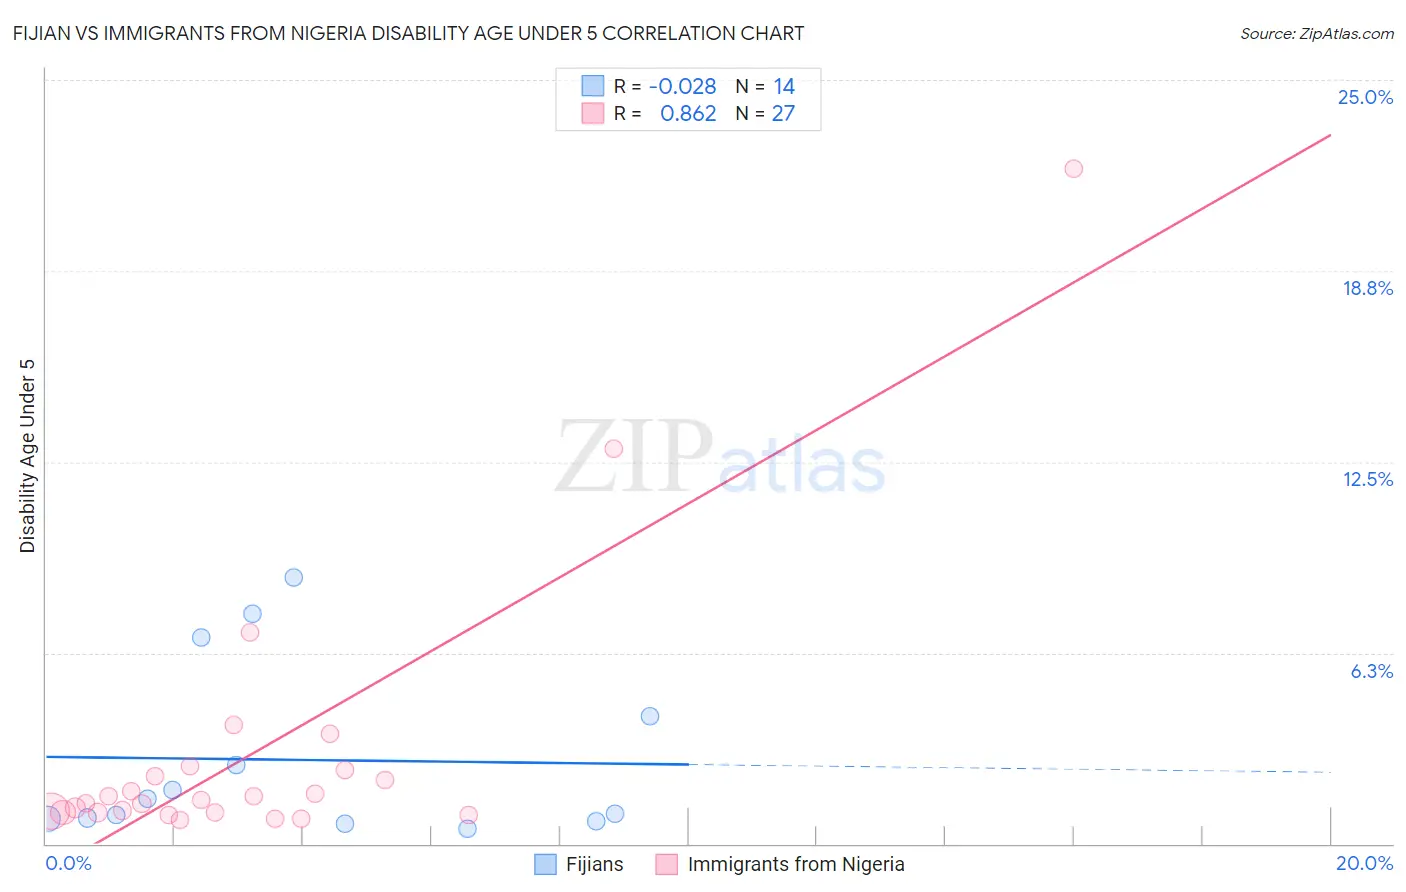
Fijian vs Immigrants from Nigeria Disability Age Under 5 Correlation Chart
The statistical analysis conducted on geographies consisting of 45,950,279 people shows no correlation between the proportion of Fijians and percentage of population with a disability under the age of 5 in the United States with a correlation coefficient (R) of -0.028 and weighted average of 1.2%. Similarly, the statistical analysis conducted on geographies consisting of 173,767,692 people shows a very strong positive correlation between the proportion of Immigrants from Nigeria and percentage of population with a disability under the age of 5 in the United States with a correlation coefficient (R) of 0.862 and weighted average of 1.2%, a difference of 4.0%.
Disability Age Under 5 Correlation Summary
| Measurement | Fijian | Immigrants from Nigeria |
| Minimum | 0.50% | 0.78% |
| Maximum | 8.7% | 22.1% |
| Range | 8.2% | 21.3% |
| Mean | 2.7% | 3.0% |
| Median | 1.2% | 1.4% |
| Interquartile 25% (IQ1) | 0.81% | 1.0% |
| Interquartile 75% (IQ3) | 4.2% | 2.4% |
| Interquartile Range (IQR) | 3.4% | 1.4% |
| Standard Deviation (Sample) | 2.9% | 4.6% |
| Standard Deviation (Population) | 2.8% | 4.5% |
Similar Demographics by Disability Age Under 5
Demographics Similar to Fijians by Disability Age Under 5
In terms of disability age under 5, the demographic groups most similar to Fijians are Moroccan (1.2%, a difference of 0.18%), Argentinean (1.2%, a difference of 0.20%), Immigrants from Eastern Africa (1.2%, a difference of 0.27%), Immigrants from Czechoslovakia (1.2%, a difference of 0.32%), and Immigrants from Spain (1.2%, a difference of 0.36%).
| Demographics | Rating | Rank | Disability Age Under 5 |
| Immigrants | France | 88.4 /100 | #128 | Excellent 1.2% |
| Immigrants | Immigrants | 88.0 /100 | #129 | Excellent 1.2% |
| Koreans | 87.7 /100 | #130 | Excellent 1.2% |
| Immigrants | Serbia | 87.6 /100 | #131 | Excellent 1.2% |
| Immigrants | Eastern Europe | 87.3 /100 | #132 | Excellent 1.2% |
| Immigrants | Spain | 86.5 /100 | #133 | Excellent 1.2% |
| Argentineans | 85.7 /100 | #134 | Excellent 1.2% |
| Fijians | 84.7 /100 | #135 | Excellent 1.2% |
| Moroccans | 83.6 /100 | #136 | Excellent 1.2% |
| Immigrants | Eastern Africa | 83.1 /100 | #137 | Excellent 1.2% |
| Immigrants | Czechoslovakia | 82.8 /100 | #138 | Excellent 1.2% |
| New Zealanders | 81.4 /100 | #139 | Excellent 1.2% |
| Somalis | 80.8 /100 | #140 | Excellent 1.2% |
| Immigrants | Honduras | 80.4 /100 | #141 | Excellent 1.2% |
| Immigrants | Colombia | 79.3 /100 | #142 | Good 1.2% |
Demographics Similar to Immigrants from Nigeria by Disability Age Under 5
In terms of disability age under 5, the demographic groups most similar to Immigrants from Nigeria are Immigrants from Latvia (1.2%, a difference of 0.0%), Immigrants from Ireland (1.2%, a difference of 0.030%), Crow (1.2%, a difference of 0.090%), Immigrants from Kenya (1.2%, a difference of 0.13%), and Comanche (1.2%, a difference of 0.22%).
| Demographics | Rating | Rank | Disability Age Under 5 |
| Sierra Leoneans | 59.1 /100 | #168 | Average 1.2% |
| Immigrants | Uruguay | 59.0 /100 | #169 | Average 1.2% |
| Immigrants | Jamaica | 58.8 /100 | #170 | Average 1.2% |
| Guamanians/Chamorros | 57.8 /100 | #171 | Average 1.2% |
| Crow | 51.0 /100 | #172 | Average 1.2% |
| Immigrants | Ireland | 50.3 /100 | #173 | Average 1.2% |
| Immigrants | Latvia | 50.0 /100 | #174 | Average 1.2% |
| Immigrants | Nigeria | 50.0 /100 | #175 | Average 1.2% |
| Immigrants | Kenya | 48.6 /100 | #176 | Average 1.2% |
| Comanche | 47.5 /100 | #177 | Average 1.2% |
| Venezuelans | 47.1 /100 | #178 | Average 1.2% |
| Immigrants | Bahamas | 45.2 /100 | #179 | Average 1.2% |
| Immigrants | Mexico | 44.4 /100 | #180 | Average 1.2% |
| Macedonians | 43.7 /100 | #181 | Average 1.2% |
| Immigrants | Peru | 43.7 /100 | #181 | Average 1.2% |