Fijian vs Inupiat Disability Age 35 to 64
COMPARE
Fijian
Inupiat
Disability Age 35 to 64
Disability Age 35 to 64 Comparison
Fijians
Inupiat
13.2%
DISABILITY AGE 35 TO 64
0.0/ 100
METRIC RATING
288th/ 347
METRIC RANK
14.1%
DISABILITY AGE 35 TO 64
0.0/ 100
METRIC RATING
308th/ 347
METRIC RANK
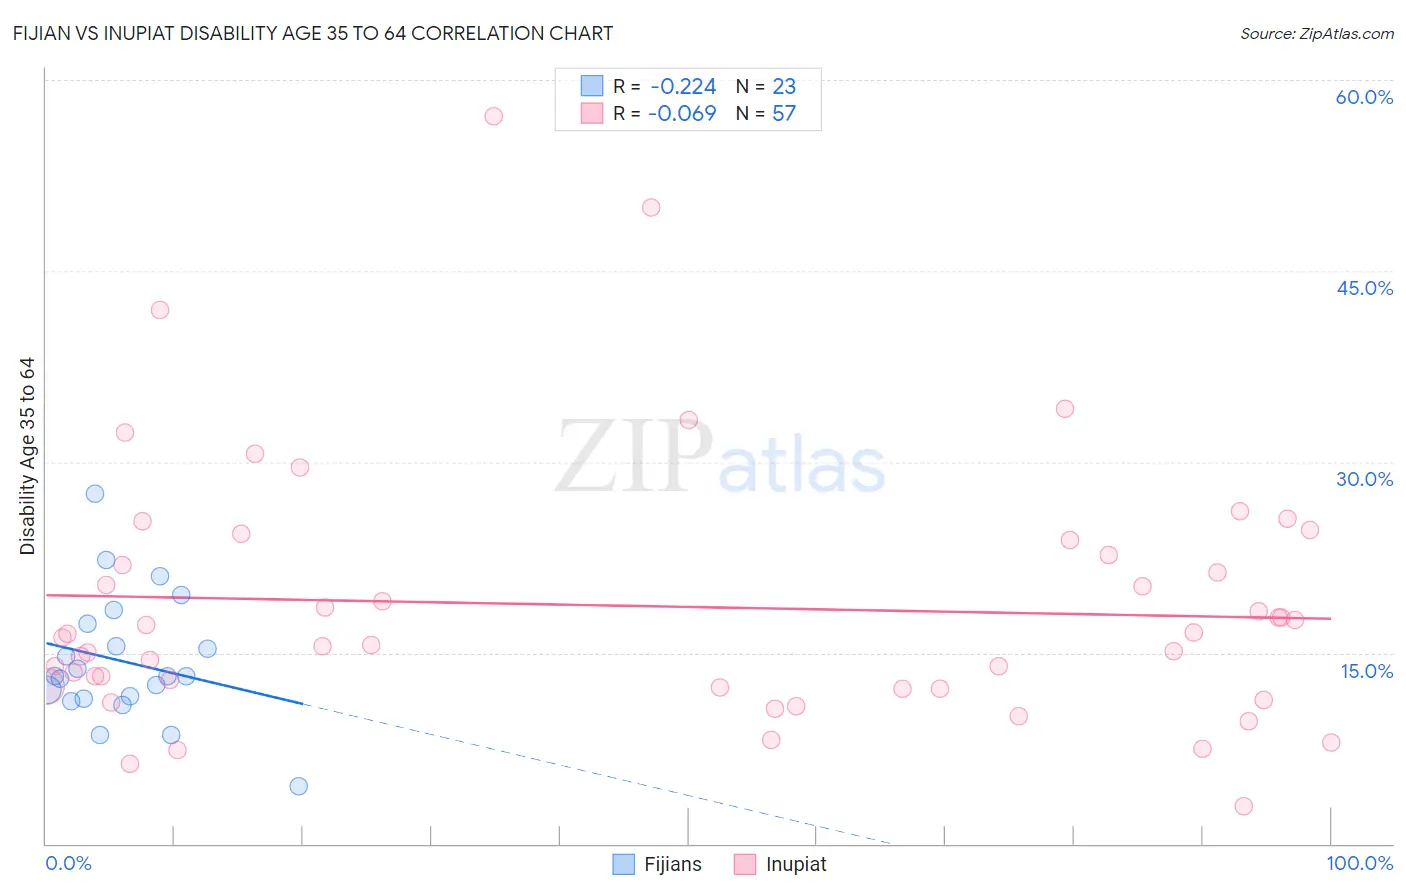
Fijian vs Inupiat Disability Age 35 to 64 Correlation Chart
The statistical analysis conducted on geographies consisting of 55,946,690 people shows a weak negative correlation between the proportion of Fijians and percentage of population with a disability between the ages 34 and 64 in the United States with a correlation coefficient (R) of -0.224 and weighted average of 13.2%. Similarly, the statistical analysis conducted on geographies consisting of 96,326,282 people shows a slight negative correlation between the proportion of Inupiat and percentage of population with a disability between the ages 34 and 64 in the United States with a correlation coefficient (R) of -0.069 and weighted average of 14.1%, a difference of 6.3%.
Disability Age 35 to 64 Correlation Summary
| Measurement | Fijian | Inupiat |
| Minimum | 4.5% | 2.9% |
| Maximum | 27.5% | 57.1% |
| Range | 22.9% | 54.2% |
| Mean | 14.3% | 18.7% |
| Median | 13.2% | 16.2% |
| Interquartile 25% (IQ1) | 11.4% | 12.2% |
| Interquartile 75% (IQ3) | 17.3% | 23.3% |
| Interquartile Range (IQR) | 5.9% | 11.1% |
| Standard Deviation (Sample) | 5.0% | 10.3% |
| Standard Deviation (Population) | 4.9% | 10.2% |
Demographics Similar to Fijians and Inupiat by Disability Age 35 to 64
In terms of disability age 35 to 64, the demographic groups most similar to Fijians are Indonesian (13.2%, a difference of 0.070%), Immigrants from Liberia (13.2%, a difference of 0.15%), Immigrants from Congo (13.3%, a difference of 0.66%), Puget Sound Salish (13.3%, a difference of 0.71%), and Ute (13.4%, a difference of 1.2%). Similarly, the demographic groups most similar to Inupiat are Blackfeet (14.1%, a difference of 0.030%), Immigrants from Yemen (14.0%, a difference of 0.19%), American (13.9%, a difference of 1.1%), Hopi (13.9%, a difference of 1.5%), and Sioux (13.9%, a difference of 1.5%).
| Demographics | Rating | Rank | Disability Age 35 to 64 |
| Fijians | 0.0 /100 | #288 | Tragic 13.2% |
| Indonesians | 0.0 /100 | #289 | Tragic 13.2% |
| Immigrants | Liberia | 0.0 /100 | #290 | Tragic 13.2% |
| Immigrants | Congo | 0.0 /100 | #291 | Tragic 13.3% |
| Puget Sound Salish | 0.0 /100 | #292 | Tragic 13.3% |
| Ute | 0.0 /100 | #293 | Tragic 13.4% |
| Yaqui | 0.0 /100 | #294 | Tragic 13.5% |
| Yakama | 0.0 /100 | #295 | Tragic 13.6% |
| Africans | 0.0 /100 | #296 | Tragic 13.6% |
| Bangladeshis | 0.0 /100 | #297 | Tragic 13.6% |
| Cheyenne | 0.0 /100 | #298 | Tragic 13.6% |
| Spanish Americans | 0.0 /100 | #299 | Tragic 13.7% |
| Delaware | 0.0 /100 | #300 | Tragic 13.7% |
| French American Indians | 0.0 /100 | #301 | Tragic 13.7% |
| Aleuts | 0.0 /100 | #302 | Tragic 13.8% |
| Sioux | 0.0 /100 | #303 | Tragic 13.9% |
| Hopi | 0.0 /100 | #304 | Tragic 13.9% |
| Americans | 0.0 /100 | #305 | Tragic 13.9% |
| Immigrants | Yemen | 0.0 /100 | #306 | Tragic 14.0% |
| Blackfeet | 0.0 /100 | #307 | Tragic 14.1% |
| Inupiat | 0.0 /100 | #308 | Tragic 14.1% |