Fijian vs Immigrants from Singapore Child Poverty Among Girls Under 16
COMPARE
Fijian
Immigrants from Singapore
Child Poverty Among Girls Under 16
Child Poverty Among Girls Under 16 Comparison
Fijians
Immigrants from Singapore
18.6%
CHILD POVERTY AMONG GIRLS UNDER 16
1.1/ 100
METRIC RATING
234th/ 347
METRIC RANK
12.5%
CHILD POVERTY AMONG GIRLS UNDER 16
100.0/ 100
METRIC RATING
9th/ 347
METRIC RANK
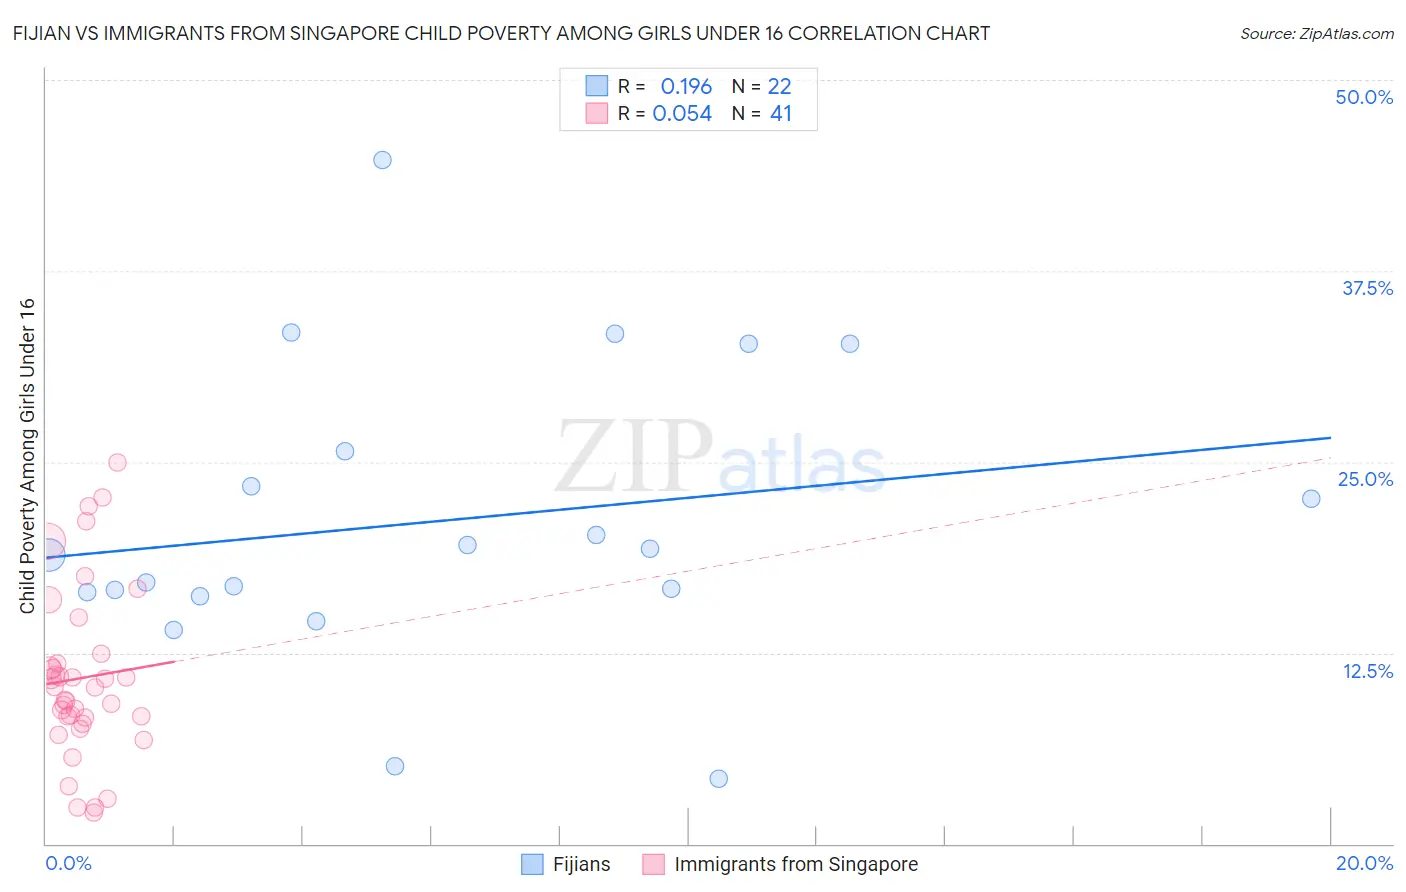
Fijian vs Immigrants from Singapore Child Poverty Among Girls Under 16 Correlation Chart
The statistical analysis conducted on geographies consisting of 55,823,808 people shows a poor positive correlation between the proportion of Fijians and poverty level among girls under the age of 16 in the United States with a correlation coefficient (R) of 0.196 and weighted average of 18.6%. Similarly, the statistical analysis conducted on geographies consisting of 136,137,761 people shows a slight positive correlation between the proportion of Immigrants from Singapore and poverty level among girls under the age of 16 in the United States with a correlation coefficient (R) of 0.054 and weighted average of 12.5%, a difference of 49.2%.
Child Poverty Among Girls Under 16 Correlation Summary
| Measurement | Fijian | Immigrants from Singapore |
| Minimum | 4.3% | 2.0% |
| Maximum | 44.7% | 25.0% |
| Range | 40.5% | 23.0% |
| Mean | 21.1% | 10.9% |
| Median | 19.1% | 10.3% |
| Interquartile 25% (IQ1) | 16.5% | 8.1% |
| Interquartile 75% (IQ3) | 25.7% | 12.1% |
| Interquartile Range (IQR) | 9.2% | 4.0% |
| Standard Deviation (Sample) | 9.6% | 5.5% |
| Standard Deviation (Population) | 9.4% | 5.5% |
Similar Demographics by Child Poverty Among Girls Under 16
Demographics Similar to Fijians by Child Poverty Among Girls Under 16
In terms of child poverty among girls under 16, the demographic groups most similar to Fijians are Nepalese (18.6%, a difference of 0.050%), Alsatian (18.6%, a difference of 0.060%), Sudanese (18.6%, a difference of 0.070%), Immigrants from Sudan (18.6%, a difference of 0.11%), and Immigrants from Nigeria (18.6%, a difference of 0.19%).
| Demographics | Rating | Rank | Child Poverty Among Girls Under 16 |
| Immigrants | Nonimmigrants | 2.0 /100 | #227 | Tragic 18.3% |
| Alaskan Athabascans | 2.0 /100 | #228 | Tragic 18.3% |
| Ghanaians | 1.4 /100 | #229 | Tragic 18.5% |
| Osage | 1.3 /100 | #230 | Tragic 18.5% |
| Cree | 1.3 /100 | #231 | Tragic 18.5% |
| Immigrants | Sudan | 1.1 /100 | #232 | Tragic 18.6% |
| Sudanese | 1.1 /100 | #233 | Tragic 18.6% |
| Fijians | 1.1 /100 | #234 | Tragic 18.6% |
| Nepalese | 1.1 /100 | #235 | Tragic 18.6% |
| Alsatians | 1.1 /100 | #236 | Tragic 18.6% |
| Immigrants | Nigeria | 1.0 /100 | #237 | Tragic 18.6% |
| Immigrants | Eritrea | 1.0 /100 | #238 | Tragic 18.7% |
| Marshallese | 0.9 /100 | #239 | Tragic 18.7% |
| Nigerians | 0.9 /100 | #240 | Tragic 18.7% |
| Americans | 0.8 /100 | #241 | Tragic 18.8% |
Demographics Similar to Immigrants from Singapore by Child Poverty Among Girls Under 16
In terms of child poverty among girls under 16, the demographic groups most similar to Immigrants from Singapore are Iranian (12.4%, a difference of 0.43%), Immigrants from Iran (12.6%, a difference of 0.94%), Chinese (12.3%, a difference of 0.96%), Immigrants from Hong Kong (12.3%, a difference of 1.1%), and Immigrants from South Central Asia (12.7%, a difference of 2.2%).
| Demographics | Rating | Rank | Child Poverty Among Girls Under 16 |
| Immigrants | Taiwan | 100.0 /100 | #2 | Exceptional 11.3% |
| Filipinos | 100.0 /100 | #3 | Exceptional 11.4% |
| Tsimshian | 100.0 /100 | #4 | Exceptional 11.5% |
| Thais | 100.0 /100 | #5 | Exceptional 11.8% |
| Immigrants | Hong Kong | 100.0 /100 | #6 | Exceptional 12.3% |
| Chinese | 100.0 /100 | #7 | Exceptional 12.3% |
| Iranians | 100.0 /100 | #8 | Exceptional 12.4% |
| Immigrants | Singapore | 100.0 /100 | #9 | Exceptional 12.5% |
| Immigrants | Iran | 100.0 /100 | #10 | Exceptional 12.6% |
| Immigrants | South Central Asia | 100.0 /100 | #11 | Exceptional 12.7% |
| Bhutanese | 100.0 /100 | #12 | Exceptional 12.7% |
| Immigrants | Ireland | 99.9 /100 | #13 | Exceptional 12.9% |
| Burmese | 99.9 /100 | #14 | Exceptional 13.0% |
| Okinawans | 99.9 /100 | #15 | Exceptional 13.0% |
| Immigrants | Lithuania | 99.9 /100 | #16 | Exceptional 13.1% |