Immigrants from Nepal vs Immigrants from Singapore Disability
COMPARE
Immigrants from Nepal
Immigrants from Singapore
Disability
Disability Comparison
Immigrants from Nepal
Immigrants from Singapore
10.8%
DISABILITY
99.9/ 100
METRIC RATING
42nd/ 347
METRIC RANK
10.0%
DISABILITY
100.0/ 100
METRIC RATING
7th/ 347
METRIC RANK
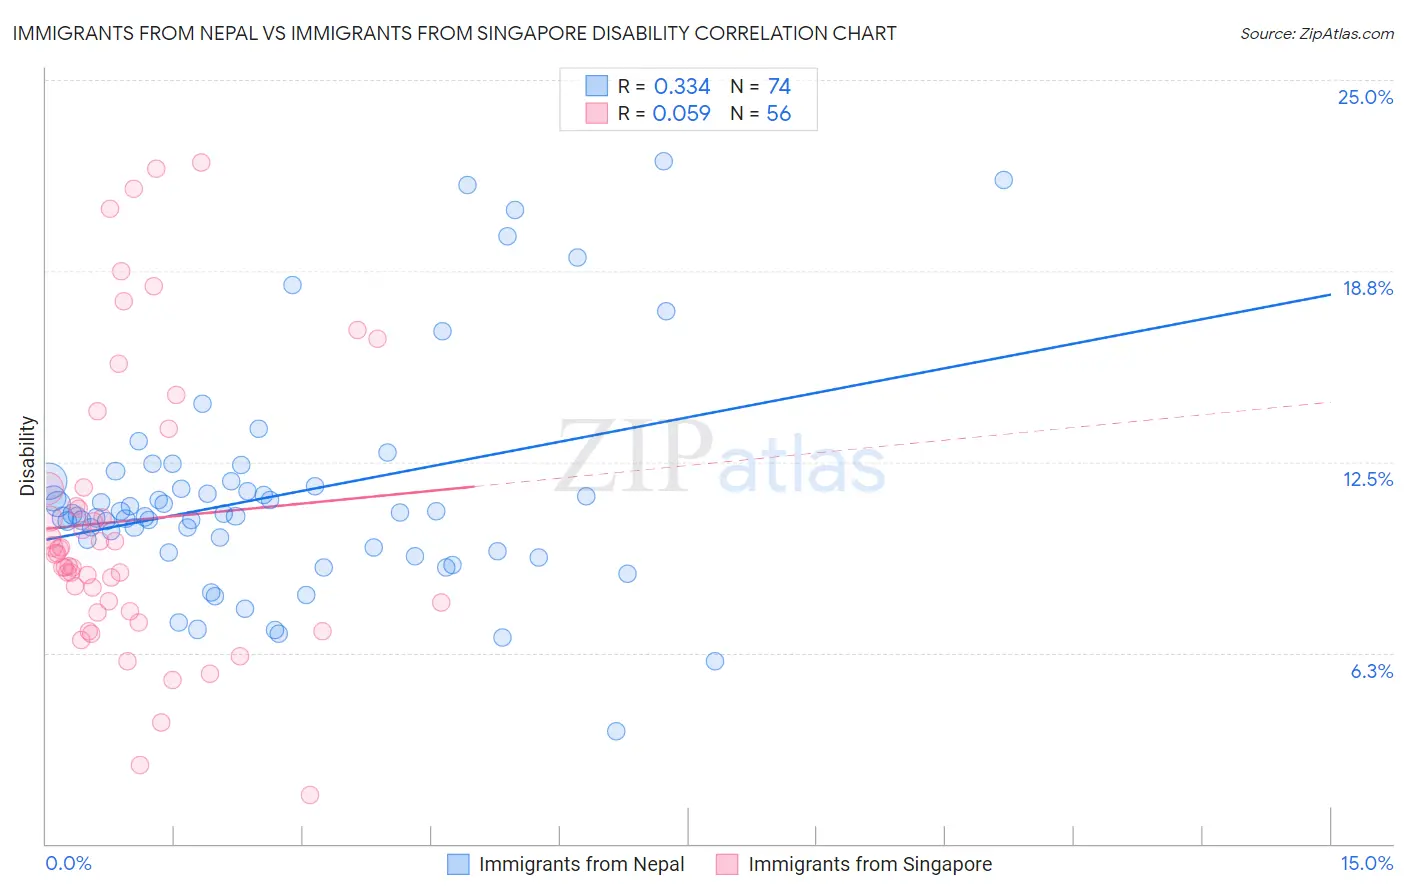
Immigrants from Nepal vs Immigrants from Singapore Disability Correlation Chart
The statistical analysis conducted on geographies consisting of 186,790,977 people shows a mild positive correlation between the proportion of Immigrants from Nepal and percentage of population with a disability in the United States with a correlation coefficient (R) of 0.334 and weighted average of 10.8%. Similarly, the statistical analysis conducted on geographies consisting of 137,520,897 people shows a slight positive correlation between the proportion of Immigrants from Singapore and percentage of population with a disability in the United States with a correlation coefficient (R) of 0.059 and weighted average of 10.0%, a difference of 8.0%.
Disability Correlation Summary
| Measurement | Immigrants from Nepal | Immigrants from Singapore |
| Minimum | 3.7% | 1.6% |
| Maximum | 22.3% | 22.3% |
| Range | 18.7% | 20.7% |
| Mean | 11.4% | 10.6% |
| Median | 10.8% | 9.5% |
| Interquartile 25% (IQ1) | 9.6% | 7.7% |
| Interquartile 75% (IQ3) | 11.9% | 11.6% |
| Interquartile Range (IQR) | 2.3% | 3.9% |
| Standard Deviation (Sample) | 3.7% | 4.7% |
| Standard Deviation (Population) | 3.6% | 4.7% |
Similar Demographics by Disability
Demographics Similar to Immigrants from Nepal by Disability
In terms of disability, the demographic groups most similar to Immigrants from Nepal are Israeli (10.8%, a difference of 0.050%), Immigrants from Australia (10.8%, a difference of 0.10%), Cambodian (10.8%, a difference of 0.14%), Mongolian (10.8%, a difference of 0.14%), and Immigrants from Japan (10.8%, a difference of 0.15%).
| Demographics | Rating | Rank | Disability |
| Immigrants | Indonesia | 100.0 /100 | #35 | Exceptional 10.7% |
| Ethiopians | 100.0 /100 | #36 | Exceptional 10.7% |
| Turks | 100.0 /100 | #37 | Exceptional 10.7% |
| Afghans | 99.9 /100 | #38 | Exceptional 10.8% |
| Cambodians | 99.9 /100 | #39 | Exceptional 10.8% |
| Mongolians | 99.9 /100 | #40 | Exceptional 10.8% |
| Immigrants | Australia | 99.9 /100 | #41 | Exceptional 10.8% |
| Immigrants | Nepal | 99.9 /100 | #42 | Exceptional 10.8% |
| Israelis | 99.9 /100 | #43 | Exceptional 10.8% |
| Immigrants | Japan | 99.9 /100 | #44 | Exceptional 10.8% |
| Immigrants | Peru | 99.9 /100 | #45 | Exceptional 10.8% |
| Tongans | 99.9 /100 | #46 | Exceptional 10.8% |
| Taiwanese | 99.9 /100 | #47 | Exceptional 10.8% |
| Soviet Union | 99.9 /100 | #48 | Exceptional 10.9% |
| Vietnamese | 99.9 /100 | #49 | Exceptional 10.9% |
Demographics Similar to Immigrants from Singapore by Disability
In terms of disability, the demographic groups most similar to Immigrants from Singapore are Bolivian (10.0%, a difference of 0.23%), Immigrants from South Central Asia (9.9%, a difference of 0.31%), Immigrants from Hong Kong (10.0%, a difference of 0.52%), Immigrants from Bolivia (9.9%, a difference of 1.2%), and Immigrants from China (10.1%, a difference of 1.3%).
| Demographics | Rating | Rank | Disability |
| Immigrants | India | 100.0 /100 | #1 | Exceptional 9.5% |
| Filipinos | 100.0 /100 | #2 | Exceptional 9.6% |
| Immigrants | Taiwan | 100.0 /100 | #3 | Exceptional 9.6% |
| Thais | 100.0 /100 | #4 | Exceptional 9.7% |
| Immigrants | Bolivia | 100.0 /100 | #5 | Exceptional 9.9% |
| Immigrants | South Central Asia | 100.0 /100 | #6 | Exceptional 9.9% |
| Immigrants | Singapore | 100.0 /100 | #7 | Exceptional 10.0% |
| Bolivians | 100.0 /100 | #8 | Exceptional 10.0% |
| Immigrants | Hong Kong | 100.0 /100 | #9 | Exceptional 10.0% |
| Immigrants | China | 100.0 /100 | #10 | Exceptional 10.1% |
| Iranians | 100.0 /100 | #11 | Exceptional 10.1% |
| Immigrants | Israel | 100.0 /100 | #12 | Exceptional 10.1% |
| Immigrants | Eastern Asia | 100.0 /100 | #13 | Exceptional 10.2% |
| Immigrants | Korea | 100.0 /100 | #14 | Exceptional 10.2% |
| Okinawans | 100.0 /100 | #15 | Exceptional 10.3% |