Immigrants from Nicaragua vs Immigrants from Middle Africa Disability
COMPARE
Immigrants from Nicaragua
Immigrants from Middle Africa
Disability
Disability Comparison
Immigrants from Nicaragua
Immigrants from Middle Africa
11.3%
DISABILITY
96.8/ 100
METRIC RATING
101st/ 347
METRIC RANK
11.6%
DISABILITY
69.5/ 100
METRIC RATING
157th/ 347
METRIC RANK
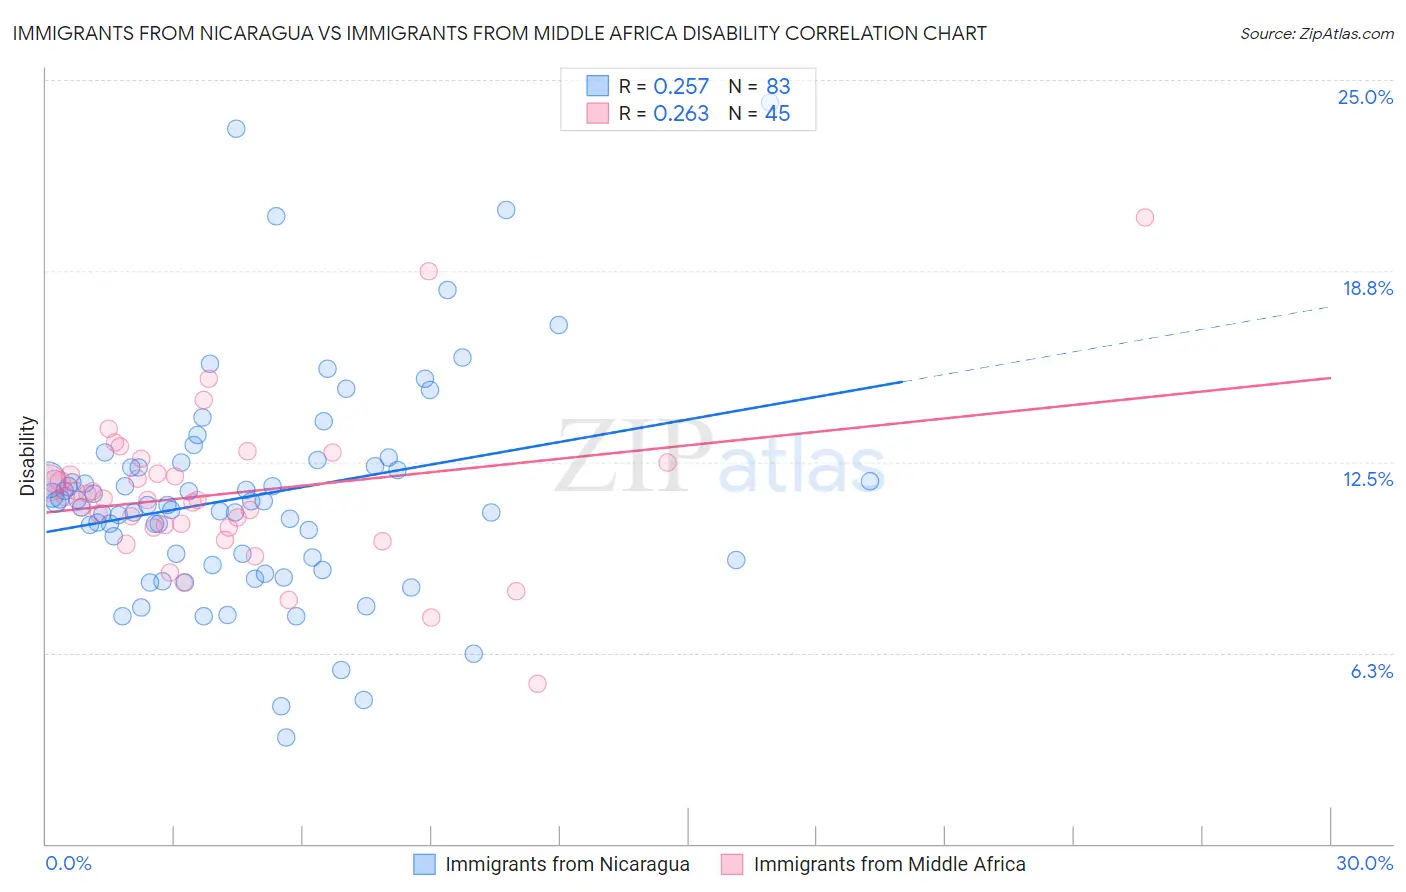
Immigrants from Nicaragua vs Immigrants from Middle Africa Disability Correlation Chart
The statistical analysis conducted on geographies consisting of 236,329,178 people shows a weak positive correlation between the proportion of Immigrants from Nicaragua and percentage of population with a disability in the United States with a correlation coefficient (R) of 0.257 and weighted average of 11.3%. Similarly, the statistical analysis conducted on geographies consisting of 202,728,715 people shows a weak positive correlation between the proportion of Immigrants from Middle Africa and percentage of population with a disability in the United States with a correlation coefficient (R) of 0.263 and weighted average of 11.6%, a difference of 3.0%.
Disability Correlation Summary
| Measurement | Immigrants from Nicaragua | Immigrants from Middle Africa |
| Minimum | 3.5% | 5.2% |
| Maximum | 24.3% | 20.5% |
| Range | 20.8% | 15.3% |
| Mean | 11.4% | 11.4% |
| Median | 11.1% | 11.3% |
| Interquartile 25% (IQ1) | 9.3% | 10.3% |
| Interquartile 75% (IQ3) | 12.3% | 12.3% |
| Interquartile Range (IQR) | 3.0% | 2.0% |
| Standard Deviation (Sample) | 3.6% | 2.6% |
| Standard Deviation (Population) | 3.6% | 2.5% |
Similar Demographics by Disability
Demographics Similar to Immigrants from Nicaragua by Disability
In terms of disability, the demographic groups most similar to Immigrants from Nicaragua are Immigrants from Greece (11.3%, a difference of 0.040%), Immigrants from Eastern Africa (11.3%, a difference of 0.060%), Immigrants from Uruguay (11.3%, a difference of 0.14%), Immigrants (11.3%, a difference of 0.14%), and Immigrants from Kazakhstan (11.3%, a difference of 0.15%).
| Demographics | Rating | Rank | Disability |
| Immigrants | Morocco | 97.8 /100 | #94 | Exceptional 11.2% |
| Eastern Europeans | 97.8 /100 | #95 | Exceptional 11.2% |
| Immigrants | Zimbabwe | 97.7 /100 | #96 | Exceptional 11.2% |
| Bhutanese | 97.4 /100 | #97 | Exceptional 11.2% |
| Uruguayans | 97.4 /100 | #98 | Exceptional 11.2% |
| Immigrants | Czechoslovakia | 97.4 /100 | #99 | Exceptional 11.2% |
| Immigrants | Greece | 96.9 /100 | #100 | Exceptional 11.3% |
| Immigrants | Nicaragua | 96.8 /100 | #101 | Exceptional 11.3% |
| Immigrants | Eastern Africa | 96.7 /100 | #102 | Exceptional 11.3% |
| Immigrants | Uruguay | 96.4 /100 | #103 | Exceptional 11.3% |
| Immigrants | Immigrants | 96.4 /100 | #104 | Exceptional 11.3% |
| Immigrants | Kazakhstan | 96.4 /100 | #105 | Exceptional 11.3% |
| Immigrants | Eastern Europe | 96.3 /100 | #106 | Exceptional 11.3% |
| Nicaraguans | 96.2 /100 | #107 | Exceptional 11.3% |
| Immigrants | Nigeria | 96.0 /100 | #108 | Exceptional 11.3% |
Demographics Similar to Immigrants from Middle Africa by Disability
In terms of disability, the demographic groups most similar to Immigrants from Middle Africa are Immigrants from Fiji (11.6%, a difference of 0.0%), Immigrants from Netherlands (11.6%, a difference of 0.020%), Immigrants from Ghana (11.6%, a difference of 0.090%), Immigrants from Guatemala (11.6%, a difference of 0.090%), and Immigrants from Kenya (11.6%, a difference of 0.14%).
| Demographics | Rating | Rank | Disability |
| Romanians | 72.7 /100 | #150 | Good 11.6% |
| Immigrants | Kenya | 72.1 /100 | #151 | Good 11.6% |
| Immigrants | Moldova | 72.0 /100 | #152 | Good 11.6% |
| Immigrants | Ghana | 71.2 /100 | #153 | Good 11.6% |
| Immigrants | Guatemala | 71.1 /100 | #154 | Good 11.6% |
| Immigrants | Netherlands | 69.8 /100 | #155 | Good 11.6% |
| Immigrants | Fiji | 69.5 /100 | #156 | Good 11.6% |
| Immigrants | Middle Africa | 69.5 /100 | #157 | Good 11.6% |
| Armenians | 65.9 /100 | #158 | Good 11.6% |
| Guatemalans | 65.1 /100 | #159 | Good 11.6% |
| Immigrants | Barbados | 64.2 /100 | #160 | Good 11.6% |
| Immigrants | Cuba | 62.8 /100 | #161 | Good 11.6% |
| Immigrants | Haiti | 59.2 /100 | #162 | Average 11.7% |
| Immigrants | Trinidad and Tobago | 58.9 /100 | #163 | Average 11.7% |
| Syrians | 58.5 /100 | #164 | Average 11.7% |