Fijian vs Carpatho Rusyn Self-Care Disability
COMPARE
Fijian
Carpatho Rusyn
Self-Care Disability
Self-Care Disability Comparison
Fijians
Carpatho Rusyns
2.7%
SELF-CARE DISABILITY
0.0/ 100
METRIC RATING
284th/ 347
METRIC RANK
2.4%
SELF-CARE DISABILITY
94.4/ 100
METRIC RATING
105th/ 347
METRIC RANK
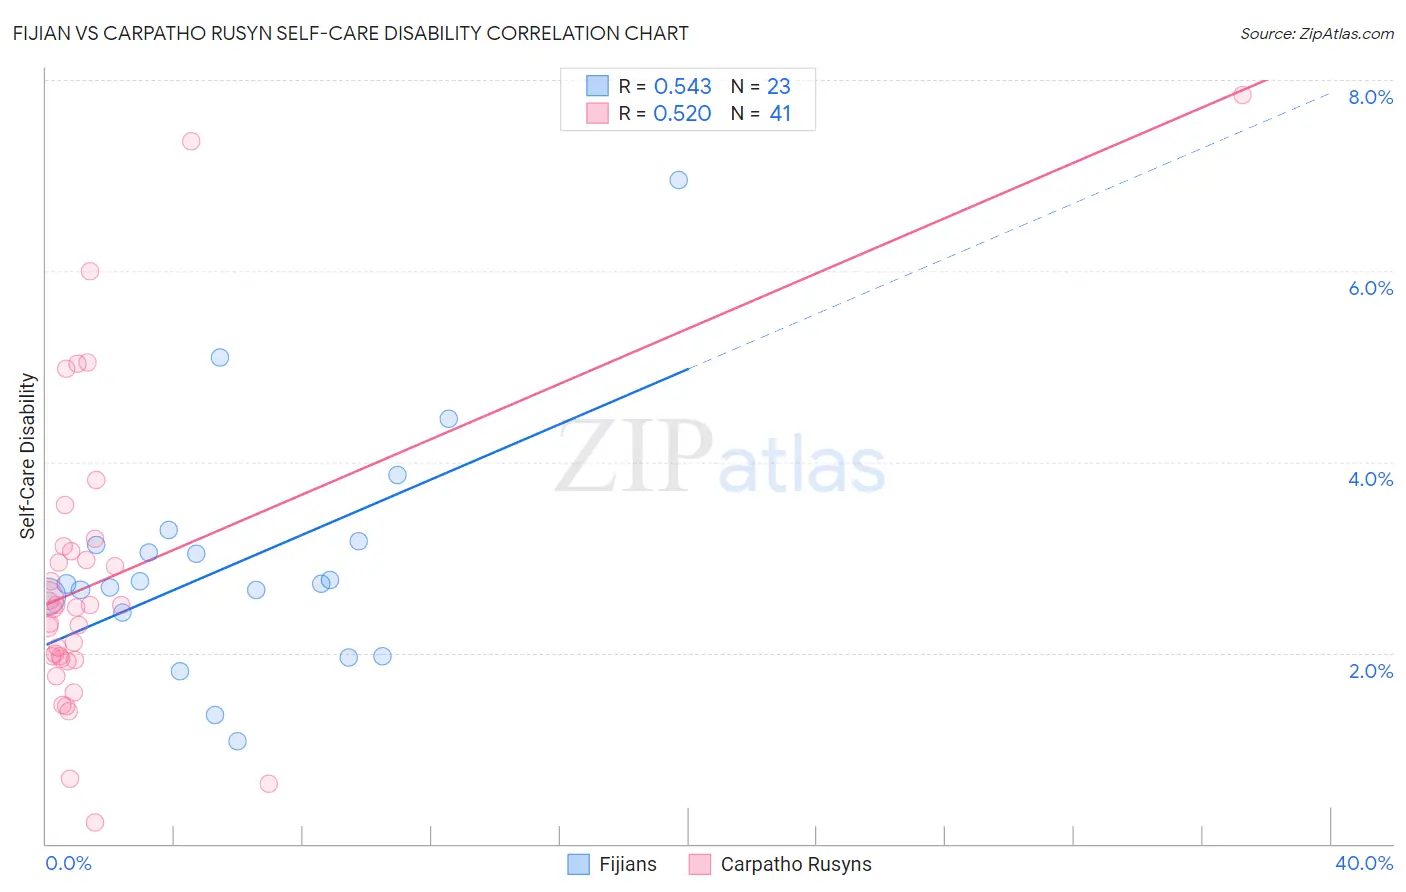
Fijian vs Carpatho Rusyn Self-Care Disability Correlation Chart
The statistical analysis conducted on geographies consisting of 55,939,234 people shows a substantial positive correlation between the proportion of Fijians and percentage of population with self-care disability in the United States with a correlation coefficient (R) of 0.543 and weighted average of 2.7%. Similarly, the statistical analysis conducted on geographies consisting of 58,870,733 people shows a substantial positive correlation between the proportion of Carpatho Rusyns and percentage of population with self-care disability in the United States with a correlation coefficient (R) of 0.520 and weighted average of 2.4%, a difference of 13.1%.
Self-Care Disability Correlation Summary
| Measurement | Fijian | Carpatho Rusyn |
| Minimum | 1.1% | 0.22% |
| Maximum | 7.0% | 7.8% |
| Range | 5.9% | 7.6% |
| Mean | 3.0% | 2.8% |
| Median | 2.7% | 2.5% |
| Interquartile 25% (IQ1) | 2.4% | 1.9% |
| Interquartile 75% (IQ3) | 3.2% | 3.1% |
| Interquartile Range (IQR) | 0.75% | 1.2% |
| Standard Deviation (Sample) | 1.2% | 1.6% |
| Standard Deviation (Population) | 1.2% | 1.6% |
Similar Demographics by Self-Care Disability
Demographics Similar to Fijians by Self-Care Disability
In terms of self-care disability, the demographic groups most similar to Fijians are Jamaican (2.7%, a difference of 0.040%), Delaware (2.7%, a difference of 0.050%), Apache (2.7%, a difference of 0.12%), Immigrants from Iraq (2.7%, a difference of 0.13%), and Hispanic or Latino (2.7%, a difference of 0.29%).
| Demographics | Rating | Rank | Self-Care Disability |
| Immigrants | Ukraine | 0.1 /100 | #277 | Tragic 2.7% |
| Ottawa | 0.1 /100 | #278 | Tragic 2.7% |
| Iroquois | 0.1 /100 | #279 | Tragic 2.7% |
| Hispanics or Latinos | 0.1 /100 | #280 | Tragic 2.7% |
| Immigrants | Iraq | 0.0 /100 | #281 | Tragic 2.7% |
| Apache | 0.0 /100 | #282 | Tragic 2.7% |
| Delaware | 0.0 /100 | #283 | Tragic 2.7% |
| Fijians | 0.0 /100 | #284 | Tragic 2.7% |
| Jamaicans | 0.0 /100 | #285 | Tragic 2.7% |
| French American Indians | 0.0 /100 | #286 | Tragic 2.7% |
| Immigrants | Jamaica | 0.0 /100 | #287 | Tragic 2.7% |
| Immigrants | Barbados | 0.0 /100 | #288 | Tragic 2.7% |
| Africans | 0.0 /100 | #289 | Tragic 2.7% |
| Cubans | 0.0 /100 | #290 | Tragic 2.7% |
| Guyanese | 0.0 /100 | #291 | Tragic 2.7% |
Demographics Similar to Carpatho Rusyns by Self-Care Disability
In terms of self-care disability, the demographic groups most similar to Carpatho Rusyns are Immigrants from Indonesia (2.4%, a difference of 0.010%), British (2.4%, a difference of 0.020%), Bhutanese (2.4%, a difference of 0.030%), Greek (2.4%, a difference of 0.050%), and Slovene (2.4%, a difference of 0.060%).
| Demographics | Rating | Rank | Self-Care Disability |
| Immigrants | Poland | 96.4 /100 | #98 | Exceptional 2.4% |
| Immigrants | Israel | 96.1 /100 | #99 | Exceptional 2.4% |
| Europeans | 95.8 /100 | #100 | Exceptional 2.4% |
| Immigrants | Scotland | 95.7 /100 | #101 | Exceptional 2.4% |
| Croatians | 95.0 /100 | #102 | Exceptional 2.4% |
| Alsatians | 94.9 /100 | #103 | Exceptional 2.4% |
| Bhutanese | 94.5 /100 | #104 | Exceptional 2.4% |
| Carpatho Rusyns | 94.4 /100 | #105 | Exceptional 2.4% |
| Immigrants | Indonesia | 94.3 /100 | #106 | Exceptional 2.4% |
| British | 94.3 /100 | #107 | Exceptional 2.4% |
| Greeks | 94.1 /100 | #108 | Exceptional 2.4% |
| Slovenes | 94.1 /100 | #109 | Exceptional 2.4% |
| Immigrants | Africa | 93.7 /100 | #110 | Exceptional 2.4% |
| Serbians | 93.6 /100 | #111 | Exceptional 2.4% |
| Scandinavians | 93.5 /100 | #112 | Exceptional 2.4% |