Fijian vs Choctaw Self-Care Disability
COMPARE
Fijian
Choctaw
Self-Care Disability
Self-Care Disability Comparison
Fijians
Choctaw
2.7%
SELF-CARE DISABILITY
0.0/ 100
METRIC RATING
284th/ 347
METRIC RANK
3.0%
SELF-CARE DISABILITY
0.0/ 100
METRIC RATING
337th/ 347
METRIC RANK
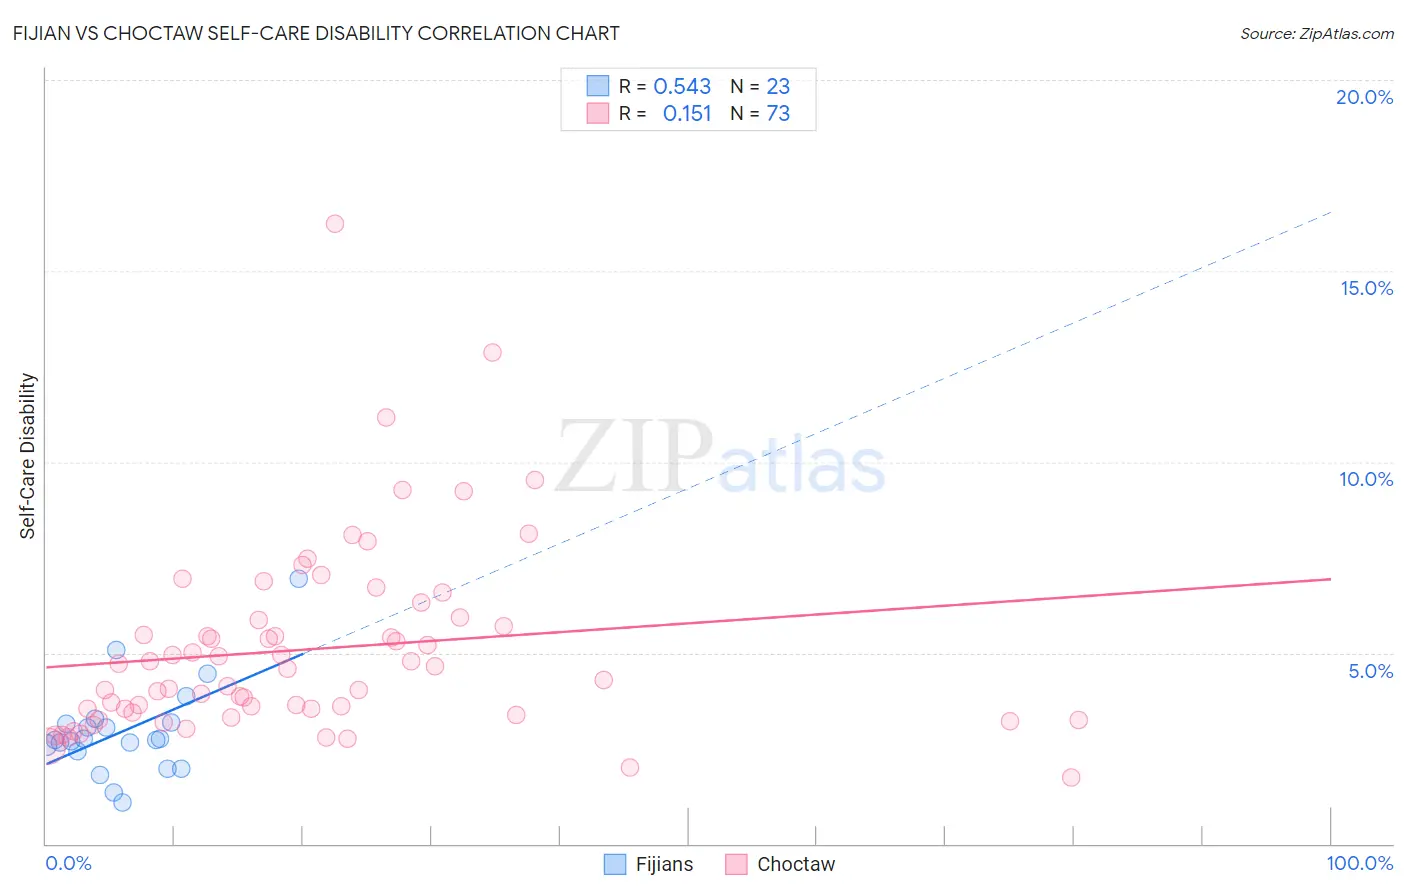
Fijian vs Choctaw Self-Care Disability Correlation Chart
The statistical analysis conducted on geographies consisting of 55,939,234 people shows a substantial positive correlation between the proportion of Fijians and percentage of population with self-care disability in the United States with a correlation coefficient (R) of 0.543 and weighted average of 2.7%. Similarly, the statistical analysis conducted on geographies consisting of 269,470,857 people shows a poor positive correlation between the proportion of Choctaw and percentage of population with self-care disability in the United States with a correlation coefficient (R) of 0.151 and weighted average of 3.0%, a difference of 12.2%.
Self-Care Disability Correlation Summary
| Measurement | Fijian | Choctaw |
| Minimum | 1.1% | 1.7% |
| Maximum | 7.0% | 16.2% |
| Range | 5.9% | 14.5% |
| Mean | 3.0% | 5.1% |
| Median | 2.7% | 4.6% |
| Interquartile 25% (IQ1) | 2.4% | 3.4% |
| Interquartile 75% (IQ3) | 3.2% | 5.9% |
| Interquartile Range (IQR) | 0.75% | 2.5% |
| Standard Deviation (Sample) | 1.2% | 2.5% |
| Standard Deviation (Population) | 1.2% | 2.5% |
Similar Demographics by Self-Care Disability
Demographics Similar to Fijians by Self-Care Disability
In terms of self-care disability, the demographic groups most similar to Fijians are Jamaican (2.7%, a difference of 0.040%), Delaware (2.7%, a difference of 0.050%), Apache (2.7%, a difference of 0.12%), Immigrants from Iraq (2.7%, a difference of 0.13%), and Hispanic or Latino (2.7%, a difference of 0.29%).
| Demographics | Rating | Rank | Self-Care Disability |
| Immigrants | Ukraine | 0.1 /100 | #277 | Tragic 2.7% |
| Ottawa | 0.1 /100 | #278 | Tragic 2.7% |
| Iroquois | 0.1 /100 | #279 | Tragic 2.7% |
| Hispanics or Latinos | 0.1 /100 | #280 | Tragic 2.7% |
| Immigrants | Iraq | 0.0 /100 | #281 | Tragic 2.7% |
| Apache | 0.0 /100 | #282 | Tragic 2.7% |
| Delaware | 0.0 /100 | #283 | Tragic 2.7% |
| Fijians | 0.0 /100 | #284 | Tragic 2.7% |
| Jamaicans | 0.0 /100 | #285 | Tragic 2.7% |
| French American Indians | 0.0 /100 | #286 | Tragic 2.7% |
| Immigrants | Jamaica | 0.0 /100 | #287 | Tragic 2.7% |
| Immigrants | Barbados | 0.0 /100 | #288 | Tragic 2.7% |
| Africans | 0.0 /100 | #289 | Tragic 2.7% |
| Cubans | 0.0 /100 | #290 | Tragic 2.7% |
| Guyanese | 0.0 /100 | #291 | Tragic 2.7% |
Demographics Similar to Choctaw by Self-Care Disability
In terms of self-care disability, the demographic groups most similar to Choctaw are Cape Verdean (3.0%, a difference of 0.31%), Immigrants from Dominican Republic (3.0%, a difference of 0.69%), Immigrants from Cabo Verde (3.1%, a difference of 1.0%), Immigrants from Yemen (3.0%, a difference of 1.1%), and Immigrants from the Azores (3.0%, a difference of 1.2%).
| Demographics | Rating | Rank | Self-Care Disability |
| Nepalese | 0.0 /100 | #330 | Tragic 3.0% |
| Lumbee | 0.0 /100 | #331 | Tragic 3.0% |
| Kiowa | 0.0 /100 | #332 | Tragic 3.0% |
| Dutch West Indians | 0.0 /100 | #333 | Tragic 3.0% |
| Houma | 0.0 /100 | #334 | Tragic 3.0% |
| Immigrants | Azores | 0.0 /100 | #335 | Tragic 3.0% |
| Immigrants | Yemen | 0.0 /100 | #336 | Tragic 3.0% |
| Choctaw | 0.0 /100 | #337 | Tragic 3.0% |
| Cape Verdeans | 0.0 /100 | #338 | Tragic 3.0% |
| Immigrants | Dominican Republic | 0.0 /100 | #339 | Tragic 3.0% |
| Immigrants | Cabo Verde | 0.0 /100 | #340 | Tragic 3.1% |
| Dominicans | 0.0 /100 | #341 | Tragic 3.1% |
| Colville | 0.0 /100 | #342 | Tragic 3.1% |
| Tohono O'odham | 0.0 /100 | #343 | Tragic 3.1% |
| Pueblo | 0.0 /100 | #344 | Tragic 3.3% |