Fijian vs Carpatho Rusyn Unemployment Among Ages 60 to 64 years
COMPARE
Fijian
Carpatho Rusyn
Unemployment Among Ages 60 to 64 years
Unemployment Among Ages 60 to 64 years Comparison
Fijians
Carpatho Rusyns
3.9%
UNEMPLOYMENT AMONG AGES 60 TO 64 YEARS
100.0/ 100
METRIC RATING
2nd/ 347
METRIC RANK
4.5%
UNEMPLOYMENT AMONG AGES 60 TO 64 YEARS
100.0/ 100
METRIC RATING
33rd/ 347
METRIC RANK
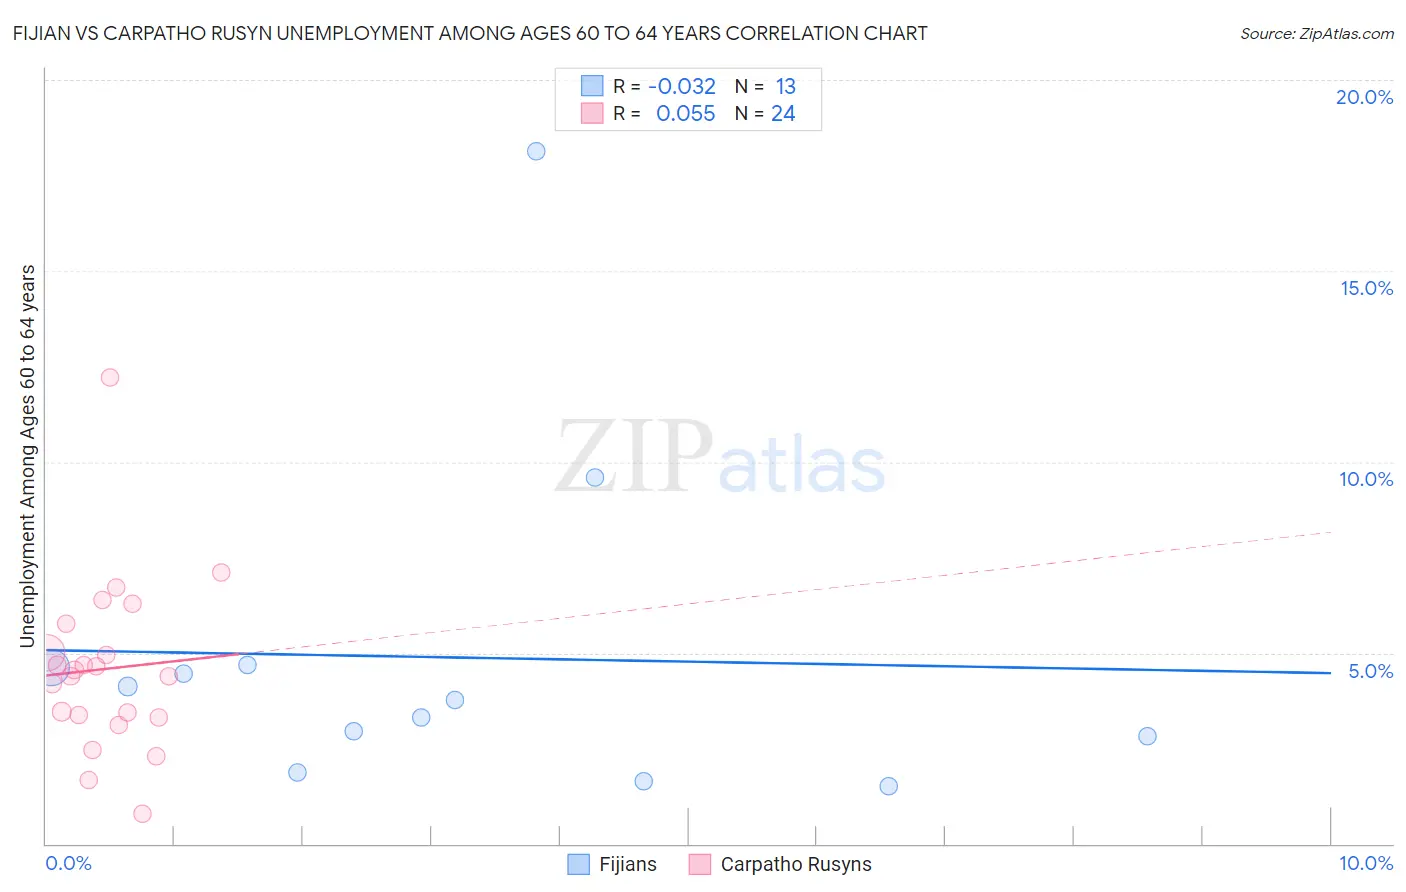
Fijian vs Carpatho Rusyn Unemployment Among Ages 60 to 64 years Correlation Chart
The statistical analysis conducted on geographies consisting of 53,532,695 people shows no correlation between the proportion of Fijians and unemployment rate among population between the ages 60 and 64 in the United States with a correlation coefficient (R) of -0.032 and weighted average of 3.9%. Similarly, the statistical analysis conducted on geographies consisting of 57,468,302 people shows a slight positive correlation between the proportion of Carpatho Rusyns and unemployment rate among population between the ages 60 and 64 in the United States with a correlation coefficient (R) of 0.055 and weighted average of 4.5%, a difference of 15.1%.
Unemployment Among Ages 60 to 64 years Correlation Summary
| Measurement | Fijian | Carpatho Rusyn |
| Minimum | 1.5% | 0.80% |
| Maximum | 18.1% | 12.2% |
| Range | 16.6% | 11.4% |
| Mean | 4.9% | 4.6% |
| Median | 3.8% | 4.5% |
| Interquartile 25% (IQ1) | 2.3% | 3.3% |
| Interquartile 75% (IQ3) | 4.6% | 5.4% |
| Interquartile Range (IQR) | 2.3% | 2.0% |
| Standard Deviation (Sample) | 4.5% | 2.3% |
| Standard Deviation (Population) | 4.3% | 2.2% |
Similar Demographics by Unemployment Among Ages 60 to 64 years
Demographics Similar to Fijians by Unemployment Among Ages 60 to 64 years
In terms of unemployment among ages 60 to 64 years, the demographic groups most similar to Fijians are Chinese (4.0%, a difference of 2.9%), Hmong (4.0%, a difference of 3.3%), Immigrants from the Azores (4.0%, a difference of 3.3%), Marshallese (3.7%, a difference of 3.7%), and Immigrants from Congo (4.1%, a difference of 6.2%).
| Demographics | Rating | Rank | Unemployment Among Ages 60 to 64 years |
| Marshallese | 100.0 /100 | #1 | Exceptional 3.7% |
| Fijians | 100.0 /100 | #2 | Exceptional 3.9% |
| Chinese | 100.0 /100 | #3 | Exceptional 4.0% |
| Hmong | 100.0 /100 | #4 | Exceptional 4.0% |
| Immigrants | Azores | 100.0 /100 | #5 | Exceptional 4.0% |
| Immigrants | Congo | 100.0 /100 | #6 | Exceptional 4.1% |
| Lumbee | 100.0 /100 | #7 | Exceptional 4.2% |
| Immigrants | Micronesia | 100.0 /100 | #8 | Exceptional 4.2% |
| Indonesians | 100.0 /100 | #9 | Exceptional 4.2% |
| Immigrants | Bosnia and Herzegovina | 100.0 /100 | #10 | Exceptional 4.2% |
| Luxembourgers | 100.0 /100 | #11 | Exceptional 4.3% |
| Immigrants | Cuba | 100.0 /100 | #12 | Exceptional 4.3% |
| Chickasaw | 100.0 /100 | #13 | Exceptional 4.3% |
| Norwegians | 100.0 /100 | #14 | Exceptional 4.3% |
| Sudanese | 100.0 /100 | #15 | Exceptional 4.3% |
Demographics Similar to Carpatho Rusyns by Unemployment Among Ages 60 to 64 years
In terms of unemployment among ages 60 to 64 years, the demographic groups most similar to Carpatho Rusyns are Zimbabwean (4.5%, a difference of 0.050%), Immigrants from Eritrea (4.5%, a difference of 0.090%), Immigrants from Venezuela (4.5%, a difference of 0.16%), Cuban (4.5%, a difference of 0.18%), and Belgian (4.5%, a difference of 0.26%).
| Demographics | Rating | Rank | Unemployment Among Ages 60 to 64 years |
| Czechs | 100.0 /100 | #26 | Exceptional 4.4% |
| Immigrants | Iraq | 100.0 /100 | #27 | Exceptional 4.5% |
| Immigrants | Nepal | 100.0 /100 | #28 | Exceptional 4.5% |
| Cubans | 100.0 /100 | #29 | Exceptional 4.5% |
| Immigrants | Venezuela | 100.0 /100 | #30 | Exceptional 4.5% |
| Immigrants | Eritrea | 100.0 /100 | #31 | Exceptional 4.5% |
| Zimbabweans | 100.0 /100 | #32 | Exceptional 4.5% |
| Carpatho Rusyns | 100.0 /100 | #33 | Exceptional 4.5% |
| Belgians | 100.0 /100 | #34 | Exceptional 4.5% |
| Germans | 100.0 /100 | #35 | Exceptional 4.5% |
| Venezuelans | 100.0 /100 | #36 | Exceptional 4.5% |
| Immigrants | Portugal | 100.0 /100 | #37 | Exceptional 4.5% |
| Native Hawaiians | 100.0 /100 | #38 | Exceptional 4.5% |
| Iraqis | 100.0 /100 | #39 | Exceptional 4.5% |
| Scandinavians | 100.0 /100 | #40 | Exceptional 4.5% |