Yuman vs Carpatho Rusyn Self-Care Disability
COMPARE
Yuman
Carpatho Rusyn
Self-Care Disability
Self-Care Disability Comparison
Yuman
Carpatho Rusyns
2.6%
SELF-CARE DISABILITY
0.8/ 100
METRIC RATING
244th/ 347
METRIC RANK
2.4%
SELF-CARE DISABILITY
94.4/ 100
METRIC RATING
105th/ 347
METRIC RANK
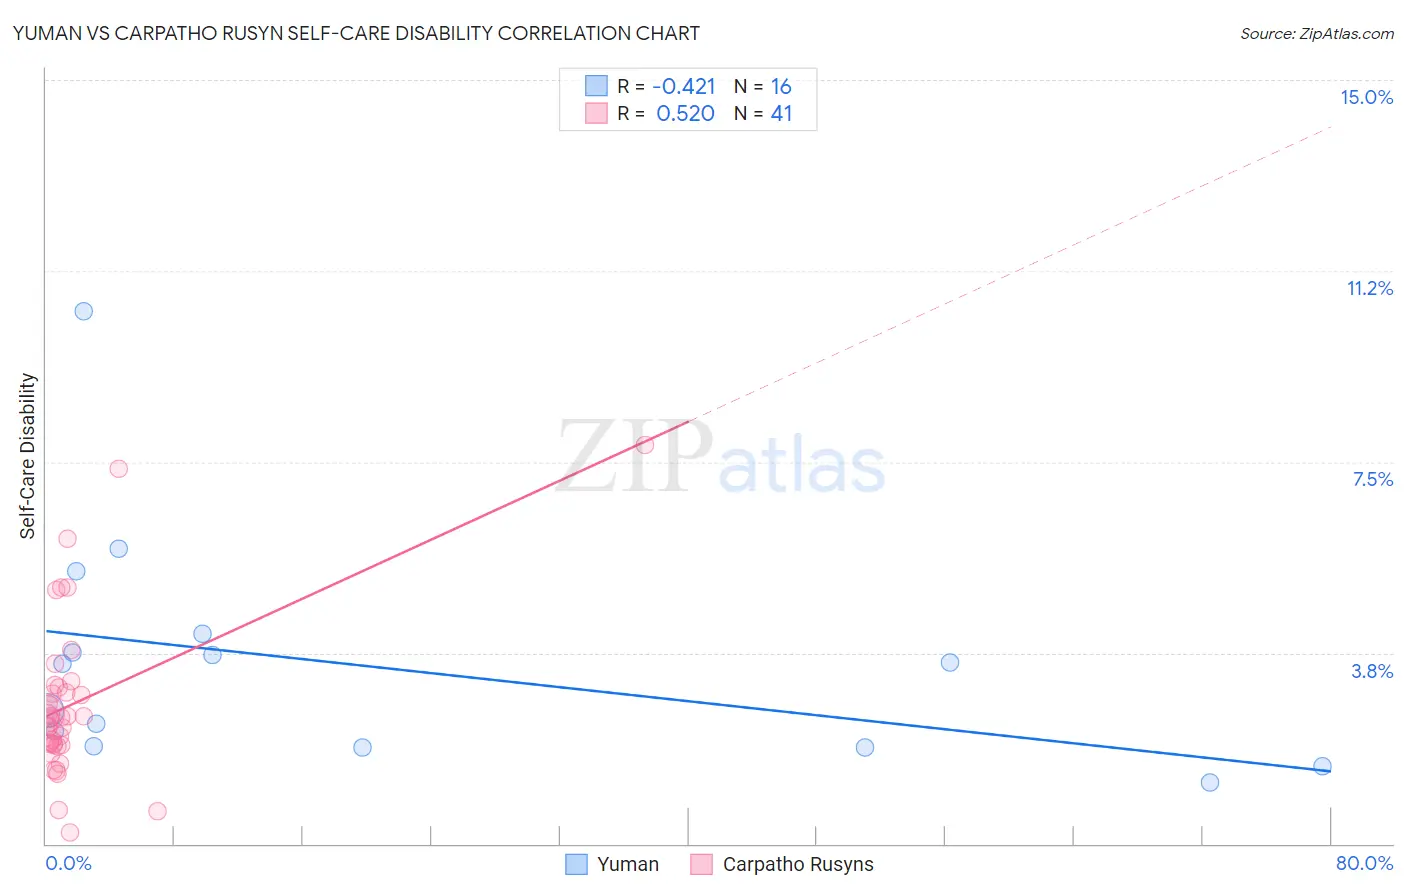
Yuman vs Carpatho Rusyn Self-Care Disability Correlation Chart
The statistical analysis conducted on geographies consisting of 40,644,588 people shows a moderate negative correlation between the proportion of Yuman and percentage of population with self-care disability in the United States with a correlation coefficient (R) of -0.421 and weighted average of 2.6%. Similarly, the statistical analysis conducted on geographies consisting of 58,870,733 people shows a substantial positive correlation between the proportion of Carpatho Rusyns and percentage of population with self-care disability in the United States with a correlation coefficient (R) of 0.520 and weighted average of 2.4%, a difference of 9.5%.
Self-Care Disability Correlation Summary
| Measurement | Yuman | Carpatho Rusyn |
| Minimum | 1.2% | 0.22% |
| Maximum | 10.5% | 7.8% |
| Range | 9.3% | 7.6% |
| Mean | 3.5% | 2.8% |
| Median | 3.1% | 2.5% |
| Interquartile 25% (IQ1) | 1.9% | 1.9% |
| Interquartile 75% (IQ3) | 3.9% | 3.1% |
| Interquartile Range (IQR) | 2.0% | 1.2% |
| Standard Deviation (Sample) | 2.3% | 1.6% |
| Standard Deviation (Population) | 2.2% | 1.6% |
Similar Demographics by Self-Care Disability
Demographics Similar to Yuman by Self-Care Disability
In terms of self-care disability, the demographic groups most similar to Yuman are Hawaiian (2.6%, a difference of 0.040%), Spanish (2.6%, a difference of 0.11%), Immigrants from Western Asia (2.6%, a difference of 0.19%), Cheyenne (2.6%, a difference of 0.21%), and Immigrants from Albania (2.6%, a difference of 0.33%).
| Demographics | Rating | Rank | Self-Care Disability |
| Immigrants | Senegal | 1.6 /100 | #237 | Tragic 2.6% |
| Senegalese | 1.3 /100 | #238 | Tragic 2.6% |
| Immigrants | Panama | 1.2 /100 | #239 | Tragic 2.6% |
| Marshallese | 1.2 /100 | #240 | Tragic 2.6% |
| Immigrants | Syria | 1.0 /100 | #241 | Tragic 2.6% |
| Spanish | 0.8 /100 | #242 | Tragic 2.6% |
| Hawaiians | 0.8 /100 | #243 | Tragic 2.6% |
| Yuman | 0.8 /100 | #244 | Tragic 2.6% |
| Immigrants | Western Asia | 0.6 /100 | #245 | Tragic 2.6% |
| Cheyenne | 0.6 /100 | #246 | Tragic 2.6% |
| Immigrants | Albania | 0.6 /100 | #247 | Tragic 2.6% |
| Nicaraguans | 0.6 /100 | #248 | Tragic 2.6% |
| Mexican American Indians | 0.5 /100 | #249 | Tragic 2.6% |
| Portuguese | 0.4 /100 | #250 | Tragic 2.6% |
| Immigrants | Liberia | 0.4 /100 | #251 | Tragic 2.6% |
Demographics Similar to Carpatho Rusyns by Self-Care Disability
In terms of self-care disability, the demographic groups most similar to Carpatho Rusyns are Immigrants from Indonesia (2.4%, a difference of 0.010%), British (2.4%, a difference of 0.020%), Bhutanese (2.4%, a difference of 0.030%), Greek (2.4%, a difference of 0.050%), and Slovene (2.4%, a difference of 0.060%).
| Demographics | Rating | Rank | Self-Care Disability |
| Immigrants | Poland | 96.4 /100 | #98 | Exceptional 2.4% |
| Immigrants | Israel | 96.1 /100 | #99 | Exceptional 2.4% |
| Europeans | 95.8 /100 | #100 | Exceptional 2.4% |
| Immigrants | Scotland | 95.7 /100 | #101 | Exceptional 2.4% |
| Croatians | 95.0 /100 | #102 | Exceptional 2.4% |
| Alsatians | 94.9 /100 | #103 | Exceptional 2.4% |
| Bhutanese | 94.5 /100 | #104 | Exceptional 2.4% |
| Carpatho Rusyns | 94.4 /100 | #105 | Exceptional 2.4% |
| Immigrants | Indonesia | 94.3 /100 | #106 | Exceptional 2.4% |
| British | 94.3 /100 | #107 | Exceptional 2.4% |
| Greeks | 94.1 /100 | #108 | Exceptional 2.4% |
| Slovenes | 94.1 /100 | #109 | Exceptional 2.4% |
| Immigrants | Africa | 93.7 /100 | #110 | Exceptional 2.4% |
| Serbians | 93.6 /100 | #111 | Exceptional 2.4% |
| Scandinavians | 93.5 /100 | #112 | Exceptional 2.4% |