Ethiopian vs Spaniard Female Unemployment
COMPARE
Ethiopian
Spaniard
Female Unemployment
Female Unemployment Comparison
Ethiopians
Spaniards
5.1%
FEMALE UNEMPLOYMENT
85.7/ 100
METRIC RATING
129th/ 347
METRIC RANK
5.3%
FEMALE UNEMPLOYMENT
25.2/ 100
METRIC RATING
196th/ 347
METRIC RANK
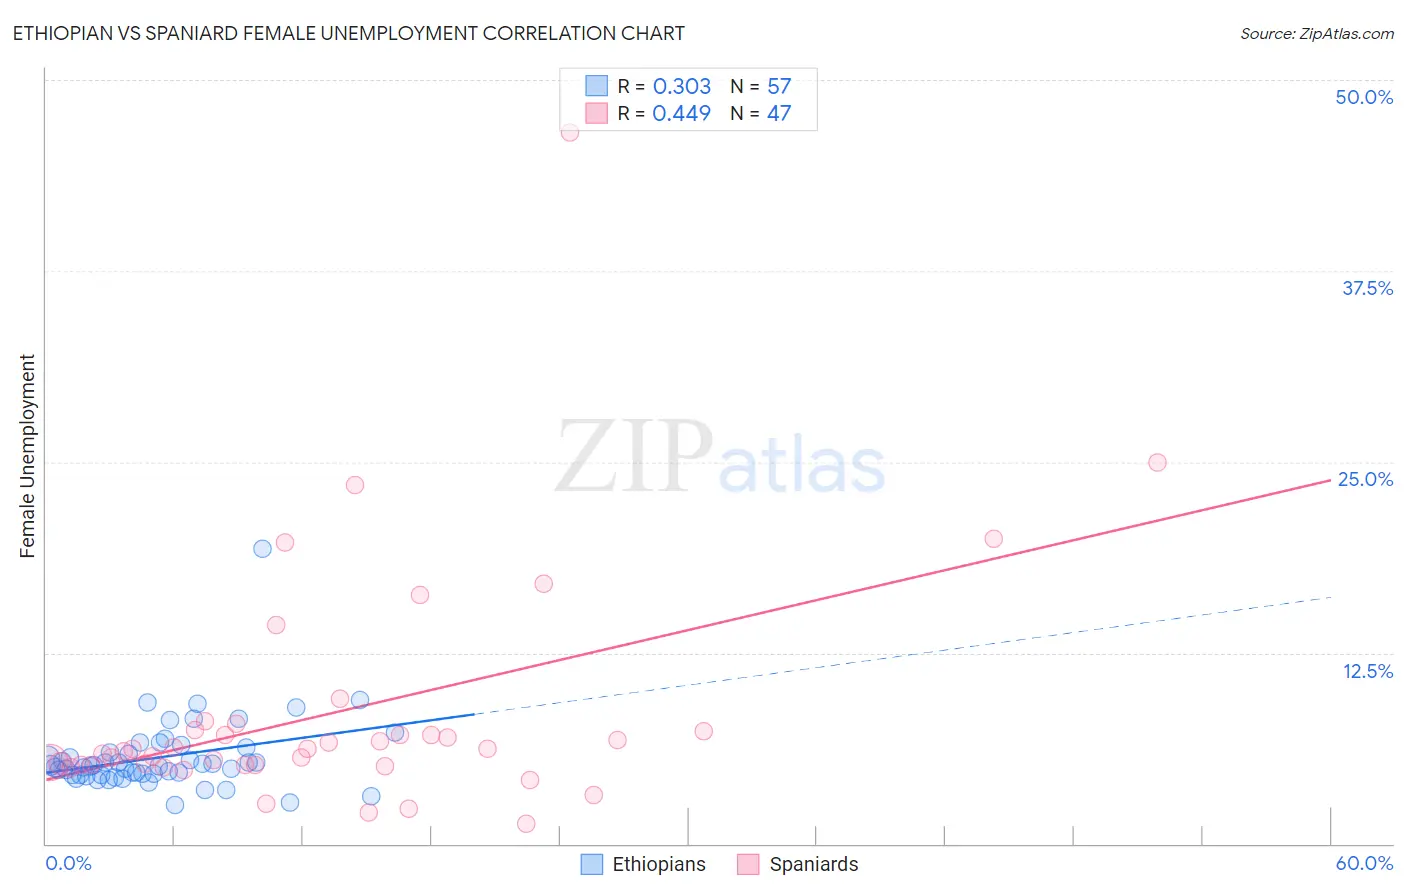
Ethiopian vs Spaniard Female Unemployment Correlation Chart
The statistical analysis conducted on geographies consisting of 222,927,979 people shows a mild positive correlation between the proportion of Ethiopians and unemploymnet rate among females in the United States with a correlation coefficient (R) of 0.303 and weighted average of 5.1%. Similarly, the statistical analysis conducted on geographies consisting of 440,755,407 people shows a moderate positive correlation between the proportion of Spaniards and unemploymnet rate among females in the United States with a correlation coefficient (R) of 0.449 and weighted average of 5.3%, a difference of 4.4%.
Female Unemployment Correlation Summary
| Measurement | Ethiopian | Spaniard |
| Minimum | 2.5% | 1.3% |
| Maximum | 19.3% | 46.6% |
| Range | 16.8% | 45.3% |
| Mean | 5.7% | 8.6% |
| Median | 5.1% | 6.2% |
| Interquartile 25% (IQ1) | 4.5% | 5.2% |
| Interquartile 75% (IQ3) | 6.1% | 7.4% |
| Interquartile Range (IQR) | 1.6% | 2.2% |
| Standard Deviation (Sample) | 2.4% | 7.8% |
| Standard Deviation (Population) | 2.4% | 7.7% |
Similar Demographics by Female Unemployment
Demographics Similar to Ethiopians by Female Unemployment
In terms of female unemployment, the demographic groups most similar to Ethiopians are Chilean (5.1%, a difference of 0.010%), Maltese (5.1%, a difference of 0.030%), Immigrants from Hungary (5.1%, a difference of 0.040%), Immigrants from Ethiopia (5.1%, a difference of 0.050%), and Immigrants from Korea (5.1%, a difference of 0.080%).
| Demographics | Rating | Rank | Female Unemployment |
| Immigrants | Germany | 87.6 /100 | #122 | Excellent 5.1% |
| Immigrants | South Africa | 87.6 /100 | #123 | Excellent 5.1% |
| Immigrants | Europe | 87.2 /100 | #124 | Excellent 5.1% |
| Basques | 86.5 /100 | #125 | Excellent 5.1% |
| Immigrants | Korea | 86.3 /100 | #126 | Excellent 5.1% |
| Immigrants | Hungary | 86.0 /100 | #127 | Excellent 5.1% |
| Chileans | 85.8 /100 | #128 | Excellent 5.1% |
| Ethiopians | 85.7 /100 | #129 | Excellent 5.1% |
| Maltese | 85.5 /100 | #130 | Excellent 5.1% |
| Immigrants | Ethiopia | 85.4 /100 | #131 | Excellent 5.1% |
| Immigrants | Sri Lanka | 85.0 /100 | #132 | Excellent 5.1% |
| Immigrants | Hong Kong | 84.8 /100 | #133 | Excellent 5.1% |
| Immigrants | Eritrea | 84.6 /100 | #134 | Excellent 5.1% |
| Immigrants | Latvia | 84.6 /100 | #135 | Excellent 5.1% |
| Indians (Asian) | 84.2 /100 | #136 | Excellent 5.1% |
Demographics Similar to Spaniards by Female Unemployment
In terms of female unemployment, the demographic groups most similar to Spaniards are Immigrants from Colombia (5.3%, a difference of 0.080%), Alsatian (5.3%, a difference of 0.10%), Colombian (5.3%, a difference of 0.14%), Tsimshian (5.4%, a difference of 0.17%), and Arab (5.3%, a difference of 0.19%).
| Demographics | Rating | Rank | Female Unemployment |
| Costa Ricans | 33.8 /100 | #189 | Fair 5.3% |
| Ugandans | 31.2 /100 | #190 | Fair 5.3% |
| Cherokee | 30.8 /100 | #191 | Fair 5.3% |
| Portuguese | 28.6 /100 | #192 | Fair 5.3% |
| Arabs | 27.7 /100 | #193 | Fair 5.3% |
| Colombians | 27.0 /100 | #194 | Fair 5.3% |
| Immigrants | Colombia | 26.2 /100 | #195 | Fair 5.3% |
| Spaniards | 25.2 /100 | #196 | Fair 5.3% |
| Alsatians | 23.9 /100 | #197 | Fair 5.3% |
| Tsimshian | 23.1 /100 | #198 | Fair 5.4% |
| Hawaiians | 22.2 /100 | #199 | Fair 5.4% |
| Soviet Union | 21.7 /100 | #200 | Fair 5.4% |
| Immigrants | Middle Africa | 20.8 /100 | #201 | Fair 5.4% |
| Iroquois | 20.8 /100 | #202 | Fair 5.4% |
| Immigrants | South Eastern Asia | 20.3 /100 | #203 | Fair 5.4% |