Immigrants from Zimbabwe vs Spaniard Hearing Disability
COMPARE
Immigrants from Zimbabwe
Spaniard
Hearing Disability
Hearing Disability Comparison
Immigrants from Zimbabwe
Spaniards
3.0%
HEARING DISABILITY
64.2/ 100
METRIC RATING
165th/ 347
METRIC RANK
3.5%
HEARING DISABILITY
0.1/ 100
METRIC RATING
268th/ 347
METRIC RANK
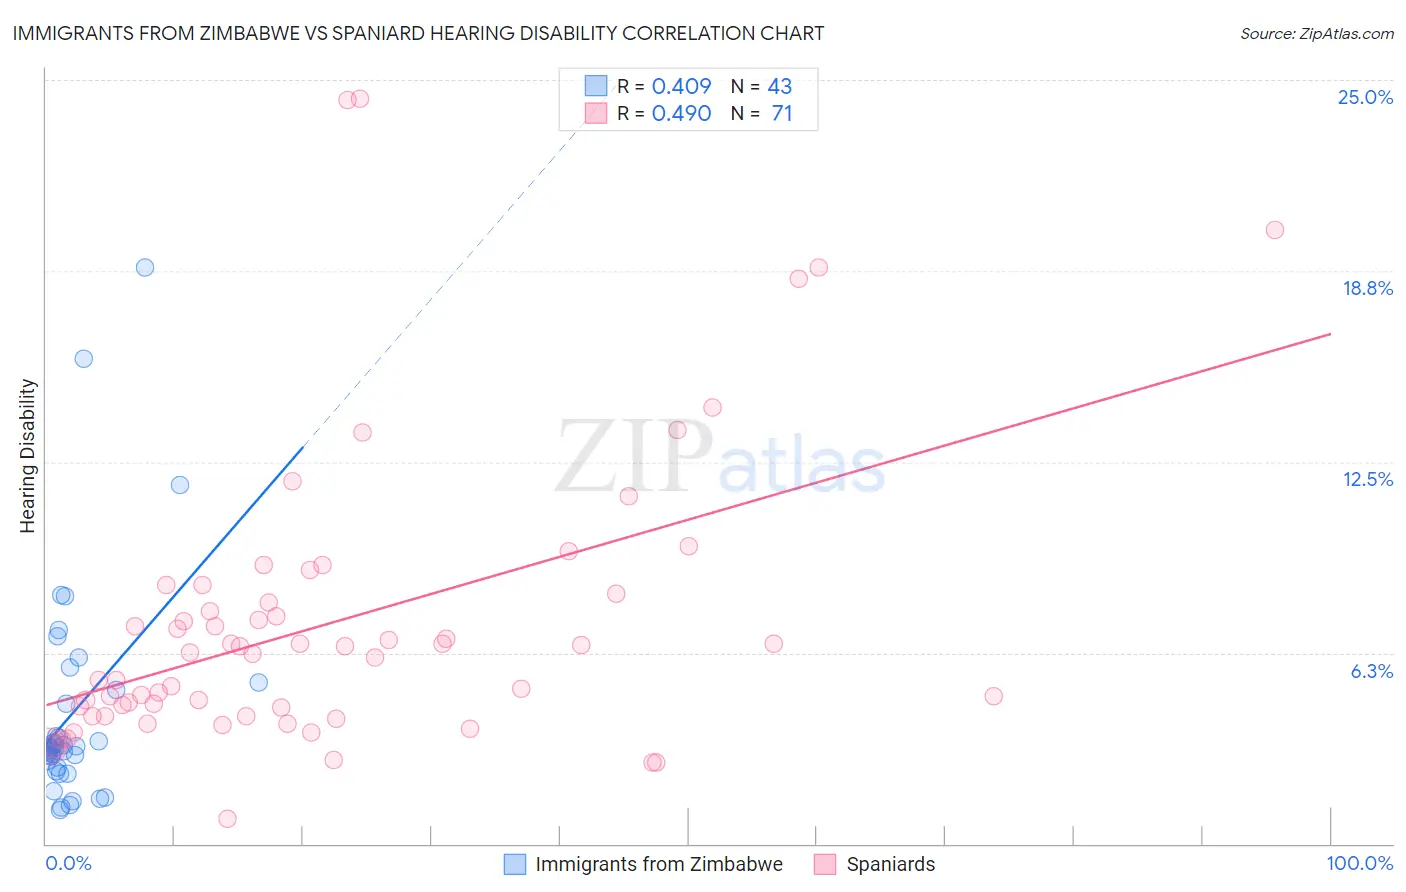
Immigrants from Zimbabwe vs Spaniard Hearing Disability Correlation Chart
The statistical analysis conducted on geographies consisting of 117,807,709 people shows a moderate positive correlation between the proportion of Immigrants from Zimbabwe and percentage of population with hearing disability in the United States with a correlation coefficient (R) of 0.409 and weighted average of 3.0%. Similarly, the statistical analysis conducted on geographies consisting of 443,274,447 people shows a moderate positive correlation between the proportion of Spaniards and percentage of population with hearing disability in the United States with a correlation coefficient (R) of 0.490 and weighted average of 3.5%, a difference of 18.1%.
Hearing Disability Correlation Summary
| Measurement | Immigrants from Zimbabwe | Spaniard |
| Minimum | 1.1% | 0.81% |
| Maximum | 18.9% | 24.4% |
| Range | 17.8% | 23.6% |
| Mean | 4.3% | 7.2% |
| Median | 3.2% | 6.2% |
| Interquartile 25% (IQ1) | 2.5% | 4.2% |
| Interquartile 75% (IQ3) | 5.0% | 8.2% |
| Interquartile Range (IQR) | 2.5% | 4.0% |
| Standard Deviation (Sample) | 3.6% | 4.7% |
| Standard Deviation (Population) | 3.6% | 4.7% |
Similar Demographics by Hearing Disability
Demographics Similar to Immigrants from Zimbabwe by Hearing Disability
In terms of hearing disability, the demographic groups most similar to Immigrants from Zimbabwe are Immigrants from Cambodia (3.0%, a difference of 0.060%), Immigrants from Central America (3.0%, a difference of 0.080%), Immigrants from South Eastern Asia (3.0%, a difference of 0.14%), Immigrants from Japan (2.9%, a difference of 0.22%), and Albanian (2.9%, a difference of 0.25%).
| Demographics | Rating | Rank | Hearing Disability |
| Immigrants | Burma/Myanmar | 69.5 /100 | #158 | Good 2.9% |
| Immigrants | Australia | 67.4 /100 | #159 | Good 2.9% |
| Immigrants | Fiji | 67.1 /100 | #160 | Good 2.9% |
| Albanians | 66.6 /100 | #161 | Good 2.9% |
| Immigrants | Japan | 66.3 /100 | #162 | Good 2.9% |
| Immigrants | Central America | 64.9 /100 | #163 | Good 3.0% |
| Immigrants | Cambodia | 64.8 /100 | #164 | Good 3.0% |
| Immigrants | Zimbabwe | 64.2 /100 | #165 | Good 3.0% |
| Immigrants | South Eastern Asia | 62.9 /100 | #166 | Good 3.0% |
| Immigrants | Eastern Europe | 58.1 /100 | #167 | Average 3.0% |
| Immigrants | Greece | 57.9 /100 | #168 | Average 3.0% |
| Arabs | 57.6 /100 | #169 | Average 3.0% |
| Immigrants | Cabo Verde | 56.9 /100 | #170 | Average 3.0% |
| Immigrants | Ukraine | 56.6 /100 | #171 | Average 3.0% |
| Armenians | 56.0 /100 | #172 | Average 3.0% |
Demographics Similar to Spaniards by Hearing Disability
In terms of hearing disability, the demographic groups most similar to Spaniards are Canadian (3.5%, a difference of 0.020%), Belgian (3.5%, a difference of 0.24%), Ute (3.5%, a difference of 0.30%), British (3.5%, a difference of 0.42%), and Immigrants from Germany (3.5%, a difference of 0.44%).
| Demographics | Rating | Rank | Hearing Disability |
| Hawaiians | 0.1 /100 | #261 | Tragic 3.5% |
| Immigrants | North America | 0.1 /100 | #262 | Tragic 3.5% |
| Immigrants | Canada | 0.1 /100 | #263 | Tragic 3.5% |
| Immigrants | Germany | 0.1 /100 | #264 | Tragic 3.5% |
| British | 0.1 /100 | #265 | Tragic 3.5% |
| Belgians | 0.1 /100 | #266 | Tragic 3.5% |
| Canadians | 0.1 /100 | #267 | Tragic 3.5% |
| Spaniards | 0.1 /100 | #268 | Tragic 3.5% |
| Ute | 0.1 /100 | #269 | Tragic 3.5% |
| Europeans | 0.1 /100 | #270 | Tragic 3.5% |
| Czechs | 0.1 /100 | #271 | Tragic 3.5% |
| Fijians | 0.0 /100 | #272 | Tragic 3.5% |
| Puerto Ricans | 0.0 /100 | #273 | Tragic 3.5% |
| Swiss | 0.0 /100 | #274 | Tragic 3.5% |
| Czechoslovakians | 0.0 /100 | #275 | Tragic 3.6% |