Yuman vs Spaniard Hearing Disability
COMPARE
Yuman
Spaniard
Hearing Disability
Hearing Disability Comparison
Yuman
Spaniards
3.4%
HEARING DISABILITY
0.4/ 100
METRIC RATING
250th/ 347
METRIC RANK
3.5%
HEARING DISABILITY
0.1/ 100
METRIC RATING
268th/ 347
METRIC RANK
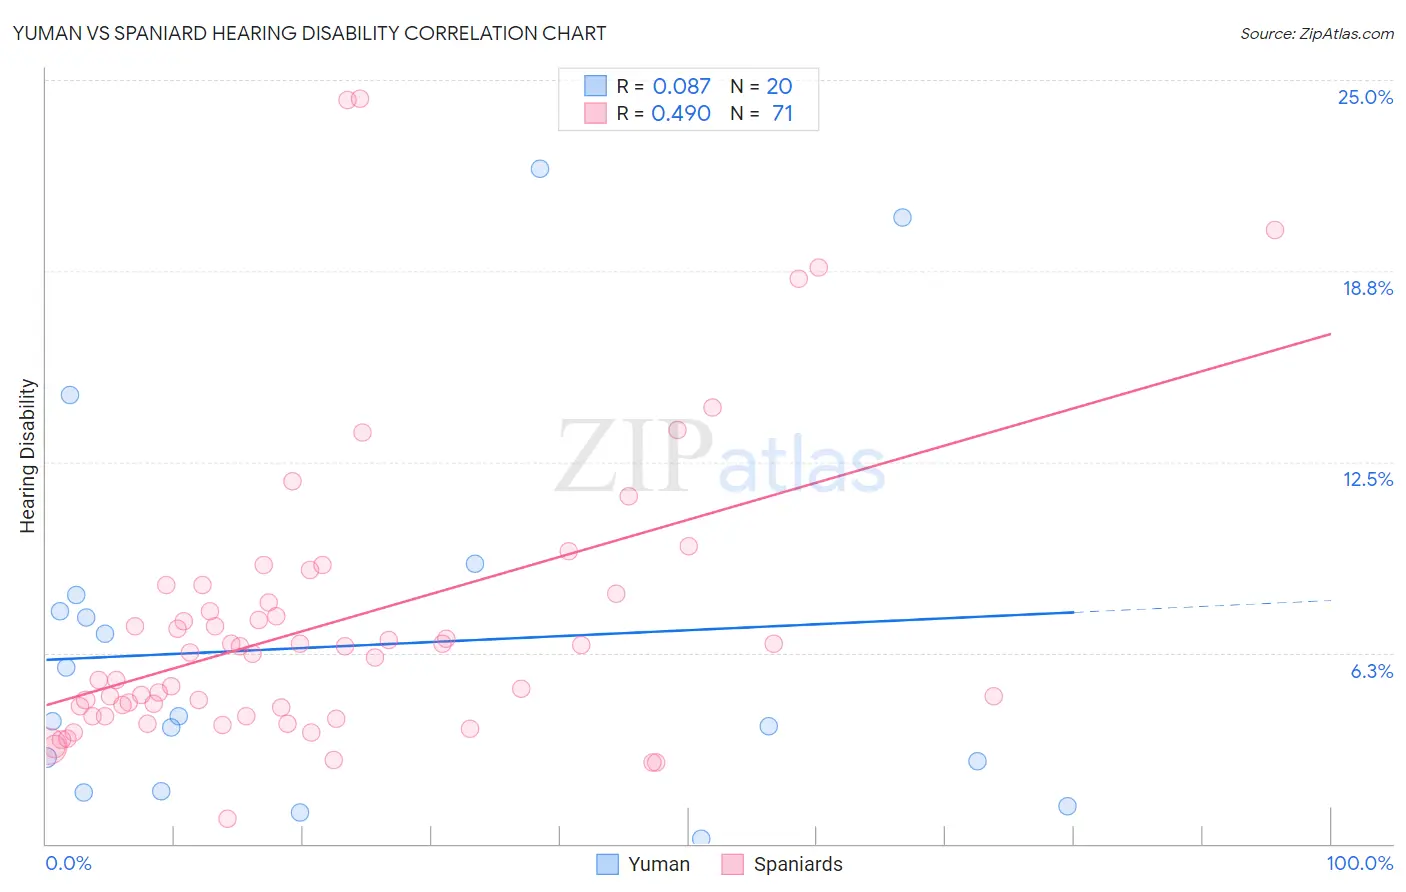
Yuman vs Spaniard Hearing Disability Correlation Chart
The statistical analysis conducted on geographies consisting of 40,662,882 people shows a slight positive correlation between the proportion of Yuman and percentage of population with hearing disability in the United States with a correlation coefficient (R) of 0.087 and weighted average of 3.4%. Similarly, the statistical analysis conducted on geographies consisting of 443,274,447 people shows a moderate positive correlation between the proportion of Spaniards and percentage of population with hearing disability in the United States with a correlation coefficient (R) of 0.490 and weighted average of 3.5%, a difference of 3.3%.
Hearing Disability Correlation Summary
| Measurement | Yuman | Spaniard |
| Minimum | 0.16% | 0.81% |
| Maximum | 22.1% | 24.4% |
| Range | 22.0% | 23.6% |
| Mean | 6.5% | 7.2% |
| Median | 4.1% | 6.2% |
| Interquartile 25% (IQ1) | 2.2% | 4.2% |
| Interquartile 75% (IQ3) | 7.9% | 8.2% |
| Interquartile Range (IQR) | 5.7% | 4.0% |
| Standard Deviation (Sample) | 6.1% | 4.7% |
| Standard Deviation (Population) | 6.0% | 4.7% |
Demographics Similar to Yuman and Spaniards by Hearing Disability
In terms of hearing disability, the demographic groups most similar to Yuman are Italian (3.4%, a difference of 0.010%), Hungarian (3.4%, a difference of 0.23%), Croatian (3.4%, a difference of 0.44%), Carpatho Rusyn (3.4%, a difference of 0.89%), and Slavic (3.4%, a difference of 1.3%). Similarly, the demographic groups most similar to Spaniards are Canadian (3.5%, a difference of 0.020%), Belgian (3.5%, a difference of 0.24%), Ute (3.5%, a difference of 0.30%), British (3.5%, a difference of 0.42%), and Immigrants from Germany (3.5%, a difference of 0.44%).
| Demographics | Rating | Rank | Hearing Disability |
| Italians | 0.4 /100 | #249 | Tragic 3.4% |
| Yuman | 0.4 /100 | #250 | Tragic 3.4% |
| Hungarians | 0.4 /100 | #251 | Tragic 3.4% |
| Croatians | 0.4 /100 | #252 | Tragic 3.4% |
| Carpatho Rusyns | 0.3 /100 | #253 | Tragic 3.4% |
| Slavs | 0.2 /100 | #254 | Tragic 3.4% |
| Poles | 0.2 /100 | #255 | Tragic 3.4% |
| Hmong | 0.2 /100 | #256 | Tragic 3.4% |
| Yaqui | 0.2 /100 | #257 | Tragic 3.4% |
| Northern Europeans | 0.2 /100 | #258 | Tragic 3.4% |
| Slovenes | 0.1 /100 | #259 | Tragic 3.5% |
| Portuguese | 0.1 /100 | #260 | Tragic 3.5% |
| Hawaiians | 0.1 /100 | #261 | Tragic 3.5% |
| Immigrants | North America | 0.1 /100 | #262 | Tragic 3.5% |
| Immigrants | Canada | 0.1 /100 | #263 | Tragic 3.5% |
| Immigrants | Germany | 0.1 /100 | #264 | Tragic 3.5% |
| British | 0.1 /100 | #265 | Tragic 3.5% |
| Belgians | 0.1 /100 | #266 | Tragic 3.5% |
| Canadians | 0.1 /100 | #267 | Tragic 3.5% |
| Spaniards | 0.1 /100 | #268 | Tragic 3.5% |
| Ute | 0.1 /100 | #269 | Tragic 3.5% |