Ethiopian vs Spaniard Seniors Poverty Over the Age of 75
COMPARE
Ethiopian
Spaniard
Seniors Poverty Over the Age of 75
Seniors Poverty Over the Age of 75 Comparison
Ethiopians
Spaniards
11.8%
SENIORS POVERTY OVER THE AGE OF 75
80.7/ 100
METRIC RATING
129th/ 347
METRIC RANK
12.2%
SENIORS POVERTY OVER THE AGE OF 75
51.6/ 100
METRIC RATING
171st/ 347
METRIC RANK
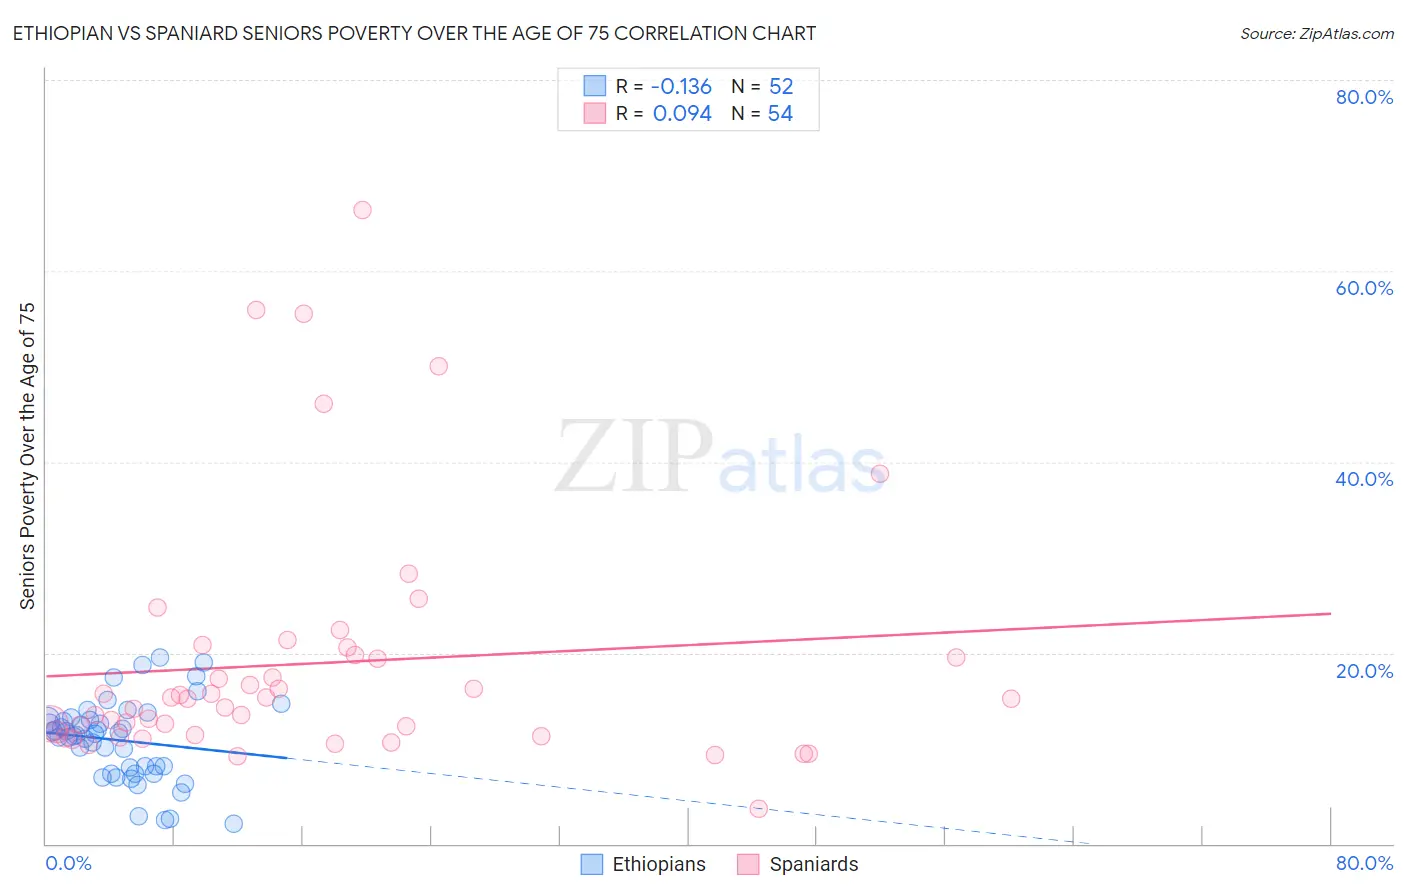
Ethiopian vs Spaniard Seniors Poverty Over the Age of 75 Correlation Chart
The statistical analysis conducted on geographies consisting of 221,776,258 people shows a poor negative correlation between the proportion of Ethiopians and poverty level among seniors over the age of 75 in the United States with a correlation coefficient (R) of -0.136 and weighted average of 11.8%. Similarly, the statistical analysis conducted on geographies consisting of 437,059,242 people shows a slight positive correlation between the proportion of Spaniards and poverty level among seniors over the age of 75 in the United States with a correlation coefficient (R) of 0.094 and weighted average of 12.2%, a difference of 2.9%.
Seniors Poverty Over the Age of 75 Correlation Summary
| Measurement | Ethiopian | Spaniard |
| Minimum | 2.1% | 3.6% |
| Maximum | 19.5% | 66.4% |
| Range | 17.4% | 62.8% |
| Mean | 10.8% | 18.9% |
| Median | 11.5% | 15.2% |
| Interquartile 25% (IQ1) | 7.7% | 11.4% |
| Interquartile 75% (IQ3) | 13.0% | 19.8% |
| Interquartile Range (IQR) | 5.3% | 8.4% |
| Standard Deviation (Sample) | 4.2% | 13.0% |
| Standard Deviation (Population) | 4.1% | 12.9% |
Similar Demographics by Seniors Poverty Over the Age of 75
Demographics Similar to Ethiopians by Seniors Poverty Over the Age of 75
In terms of seniors poverty over the age of 75, the demographic groups most similar to Ethiopians are Spanish (11.8%, a difference of 0.020%), Immigrants from Western Europe (11.9%, a difference of 0.14%), Immigrants from Hungary (11.8%, a difference of 0.15%), Immigrants from Denmark (11.8%, a difference of 0.27%), and Lebanese (11.9%, a difference of 0.30%).
| Demographics | Rating | Rank | Seniors Poverty Over the Age of 75 |
| Pakistanis | 84.0 /100 | #122 | Excellent 11.8% |
| Immigrants | Italy | 84.0 /100 | #123 | Excellent 11.8% |
| Fijians | 83.8 /100 | #124 | Excellent 11.8% |
| Sudanese | 83.6 /100 | #125 | Excellent 11.8% |
| Pennsylvania Germans | 83.4 /100 | #126 | Excellent 11.8% |
| Immigrants | Denmark | 82.6 /100 | #127 | Excellent 11.8% |
| Immigrants | Hungary | 81.7 /100 | #128 | Excellent 11.8% |
| Ethiopians | 80.7 /100 | #129 | Excellent 11.8% |
| Spanish | 80.5 /100 | #130 | Excellent 11.8% |
| Immigrants | Western Europe | 79.6 /100 | #131 | Good 11.9% |
| Lebanese | 78.3 /100 | #132 | Good 11.9% |
| Immigrants | Sierra Leone | 77.6 /100 | #133 | Good 11.9% |
| Ugandans | 77.1 /100 | #134 | Good 11.9% |
| Immigrants | Ireland | 76.2 /100 | #135 | Good 11.9% |
| Immigrants | Philippines | 75.0 /100 | #136 | Good 11.9% |
Demographics Similar to Spaniards by Seniors Poverty Over the Age of 75
In terms of seniors poverty over the age of 75, the demographic groups most similar to Spaniards are Immigrants from Fiji (12.2%, a difference of 0.010%), Immigrants from Thailand (12.2%, a difference of 0.030%), Arab (12.2%, a difference of 0.090%), Immigrants from Europe (12.2%, a difference of 0.13%), and Immigrants from Saudi Arabia (12.2%, a difference of 0.17%).
| Demographics | Rating | Rank | Seniors Poverty Over the Age of 75 |
| Potawatomi | 57.4 /100 | #164 | Average 12.1% |
| Okinawans | 56.3 /100 | #165 | Average 12.1% |
| Egyptians | 54.8 /100 | #166 | Average 12.1% |
| Immigrants | Switzerland | 54.5 /100 | #167 | Average 12.1% |
| Immigrants | Syria | 53.9 /100 | #168 | Average 12.2% |
| Immigrants | Egypt | 53.7 /100 | #169 | Average 12.2% |
| Immigrants | Thailand | 52.0 /100 | #170 | Average 12.2% |
| Spaniards | 51.6 /100 | #171 | Average 12.2% |
| Immigrants | Fiji | 51.5 /100 | #172 | Average 12.2% |
| Arabs | 50.5 /100 | #173 | Average 12.2% |
| Immigrants | Europe | 50.0 /100 | #174 | Average 12.2% |
| Immigrants | Saudi Arabia | 49.5 /100 | #175 | Average 12.2% |
| Immigrants | Iran | 48.1 /100 | #176 | Average 12.2% |
| Immigrants | Asia | 47.8 /100 | #177 | Average 12.2% |
| Immigrants | Nonimmigrants | 46.8 /100 | #178 | Average 12.2% |