Cambodian vs Immigrants from Middle Africa Hearing Disability
COMPARE
Cambodian
Immigrants from Middle Africa
Hearing Disability
Hearing Disability Comparison
Cambodians
Immigrants from Middle Africa
2.8%
HEARING DISABILITY
91.1/ 100
METRIC RATING
114th/ 347
METRIC RANK
2.8%
HEARING DISABILITY
96.5/ 100
METRIC RATING
91st/ 347
METRIC RANK
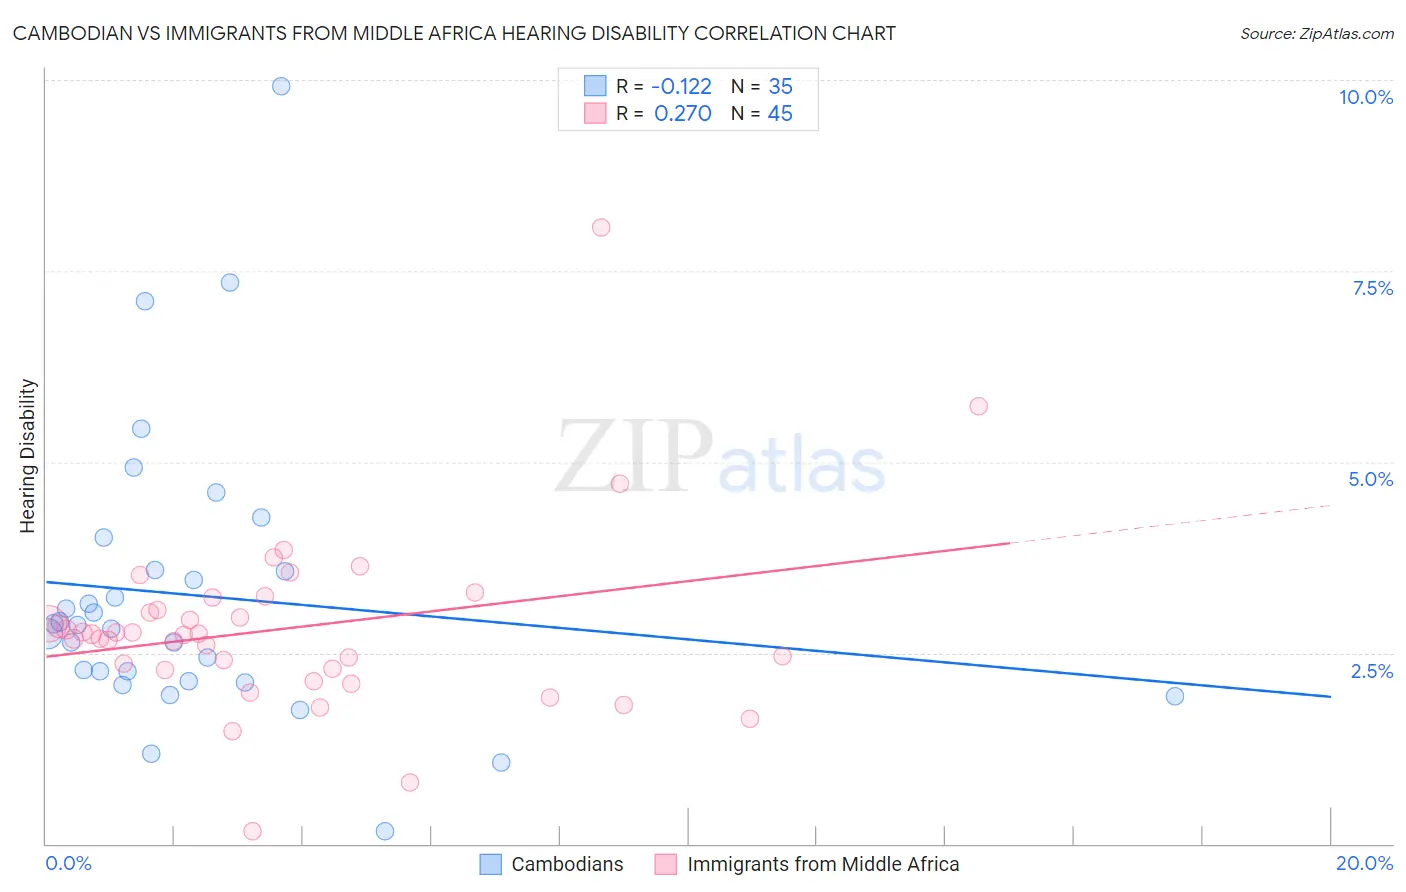
Cambodian vs Immigrants from Middle Africa Hearing Disability Correlation Chart
The statistical analysis conducted on geographies consisting of 102,495,279 people shows a poor negative correlation between the proportion of Cambodians and percentage of population with hearing disability in the United States with a correlation coefficient (R) of -0.122 and weighted average of 2.8%. Similarly, the statistical analysis conducted on geographies consisting of 202,695,899 people shows a weak positive correlation between the proportion of Immigrants from Middle Africa and percentage of population with hearing disability in the United States with a correlation coefficient (R) of 0.270 and weighted average of 2.8%, a difference of 2.5%.
Hearing Disability Correlation Summary
| Measurement | Cambodian | Immigrants from Middle Africa |
| Minimum | 0.17% | 0.16% |
| Maximum | 9.9% | 8.1% |
| Range | 9.7% | 7.9% |
| Mean | 3.3% | 2.8% |
| Median | 2.9% | 2.7% |
| Interquartile 25% (IQ1) | 2.1% | 2.3% |
| Interquartile 75% (IQ3) | 3.6% | 3.1% |
| Interquartile Range (IQR) | 1.4% | 0.87% |
| Standard Deviation (Sample) | 1.9% | 1.2% |
| Standard Deviation (Population) | 1.9% | 1.2% |
Similar Demographics by Hearing Disability
Demographics Similar to Cambodians by Hearing Disability
In terms of hearing disability, the demographic groups most similar to Cambodians are Immigrants from Belarus (2.8%, a difference of 0.17%), Immigrants from Latin America (2.8%, a difference of 0.17%), Immigrants (2.8%, a difference of 0.24%), Immigrants from Liberia (2.8%, a difference of 0.32%), and Zimbabwean (2.8%, a difference of 0.34%).
| Demographics | Rating | Rank | Hearing Disability |
| Immigrants | Chile | 93.4 /100 | #107 | Exceptional 2.8% |
| Guatemalans | 93.2 /100 | #108 | Exceptional 2.8% |
| Turks | 93.0 /100 | #109 | Exceptional 2.8% |
| Cypriots | 92.9 /100 | #110 | Exceptional 2.8% |
| Immigrants | Yemen | 92.7 /100 | #111 | Exceptional 2.8% |
| U.S. Virgin Islanders | 92.5 /100 | #112 | Exceptional 2.8% |
| Immigrants | Belarus | 91.6 /100 | #113 | Exceptional 2.8% |
| Cambodians | 91.1 /100 | #114 | Exceptional 2.8% |
| Immigrants | Latin America | 90.5 /100 | #115 | Exceptional 2.8% |
| Immigrants | Immigrants | 90.3 /100 | #116 | Exceptional 2.8% |
| Immigrants | Liberia | 90.0 /100 | #117 | Excellent 2.8% |
| Zimbabweans | 89.9 /100 | #118 | Excellent 2.8% |
| Kenyans | 89.8 /100 | #119 | Excellent 2.8% |
| Jordanians | 89.5 /100 | #120 | Excellent 2.8% |
| Cubans | 89.4 /100 | #121 | Excellent 2.8% |
Demographics Similar to Immigrants from Middle Africa by Hearing Disability
In terms of hearing disability, the demographic groups most similar to Immigrants from Middle Africa are Iranian (2.8%, a difference of 0.030%), Immigrants from Morocco (2.8%, a difference of 0.080%), Belizean (2.8%, a difference of 0.11%), Immigrants from Turkey (2.8%, a difference of 0.13%), and Immigrants from Kuwait (2.8%, a difference of 0.15%).
| Demographics | Rating | Rank | Hearing Disability |
| Immigrants | Argentina | 97.0 /100 | #84 | Exceptional 2.8% |
| Immigrants | Northern Africa | 96.9 /100 | #85 | Exceptional 2.8% |
| Immigrants | Iran | 96.8 /100 | #86 | Exceptional 2.8% |
| Somalis | 96.7 /100 | #87 | Exceptional 2.8% |
| Immigrants | Turkey | 96.7 /100 | #88 | Exceptional 2.8% |
| Belizeans | 96.6 /100 | #89 | Exceptional 2.8% |
| Immigrants | Morocco | 96.6 /100 | #90 | Exceptional 2.8% |
| Immigrants | Middle Africa | 96.5 /100 | #91 | Exceptional 2.8% |
| Iranians | 96.4 /100 | #92 | Exceptional 2.8% |
| Immigrants | Kuwait | 96.3 /100 | #93 | Exceptional 2.8% |
| Uruguayans | 95.9 /100 | #94 | Exceptional 2.8% |
| Israelis | 95.9 /100 | #95 | Exceptional 2.8% |
| Immigrants | Somalia | 95.5 /100 | #96 | Exceptional 2.8% |
| Immigrants | Afghanistan | 95.3 /100 | #97 | Exceptional 2.8% |
| Immigrants | Honduras | 95.1 /100 | #98 | Exceptional 2.8% |