Ethiopian vs Immigrants from Middle Africa College, Under 1 year
COMPARE
Ethiopian
Immigrants from Middle Africa
College, Under 1 year
College, Under 1 year Comparison
Ethiopians
Immigrants from Middle Africa
68.3%
COLLEGE, UNDER 1 YEAR
98.2/ 100
METRIC RATING
89th/ 347
METRIC RANK
63.9%
COLLEGE, UNDER 1 YEAR
10.5/ 100
METRIC RATING
212th/ 347
METRIC RANK
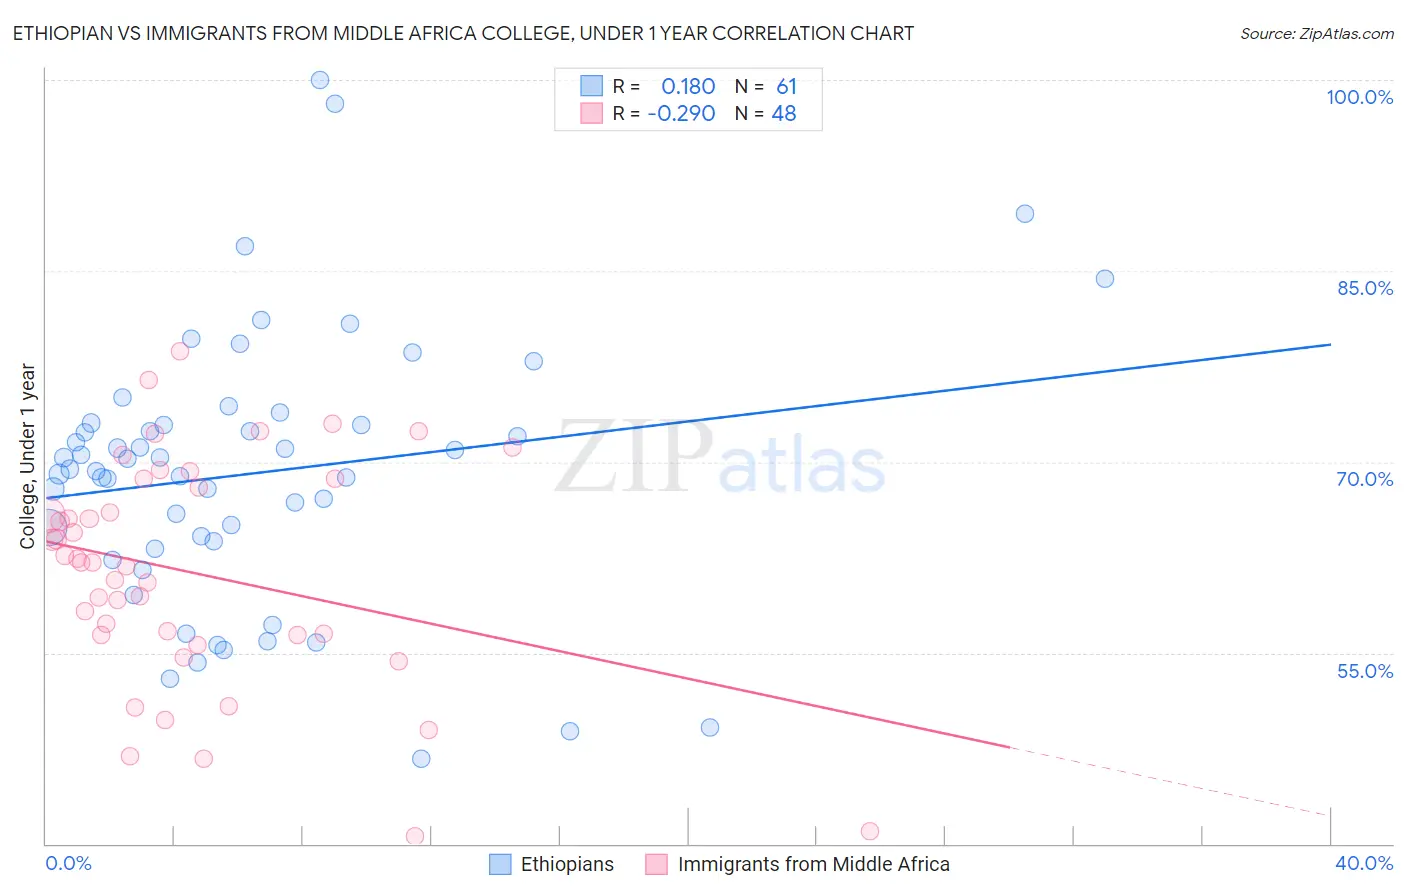
Ethiopian vs Immigrants from Middle Africa College, Under 1 year Correlation Chart
The statistical analysis conducted on geographies consisting of 223,260,030 people shows a poor positive correlation between the proportion of Ethiopians and percentage of population with at least college, under 1 year education in the United States with a correlation coefficient (R) of 0.180 and weighted average of 68.3%. Similarly, the statistical analysis conducted on geographies consisting of 202,746,410 people shows a weak negative correlation between the proportion of Immigrants from Middle Africa and percentage of population with at least college, under 1 year education in the United States with a correlation coefficient (R) of -0.290 and weighted average of 63.9%, a difference of 6.9%.
College, Under 1 year Correlation Summary
| Measurement | Ethiopian | Immigrants from Middle Africa |
| Minimum | 46.6% | 40.6% |
| Maximum | 100.0% | 78.7% |
| Range | 53.4% | 38.1% |
| Mean | 69.1% | 61.3% |
| Median | 69.4% | 62.1% |
| Interquartile 25% (IQ1) | 63.5% | 56.4% |
| Interquartile 75% (IQ3) | 73.0% | 68.4% |
| Interquartile Range (IQR) | 9.5% | 11.9% |
| Standard Deviation (Sample) | 10.6% | 8.8% |
| Standard Deviation (Population) | 10.6% | 8.7% |
Similar Demographics by College, Under 1 year
Demographics Similar to Ethiopians by College, Under 1 year
In terms of college, under 1 year, the demographic groups most similar to Ethiopians are Croatian (68.3%, a difference of 0.010%), Chinese (68.3%, a difference of 0.030%), Immigrants from Lebanon (68.3%, a difference of 0.050%), Immigrants from Hungary (68.3%, a difference of 0.060%), and Egyptian (68.3%, a difference of 0.060%).
| Demographics | Rating | Rank | College, Under 1 year |
| Norwegians | 98.4 /100 | #82 | Exceptional 68.4% |
| Argentineans | 98.4 /100 | #83 | Exceptional 68.4% |
| Immigrants | Hungary | 98.3 /100 | #84 | Exceptional 68.3% |
| Egyptians | 98.3 /100 | #85 | Exceptional 68.3% |
| Immigrants | Lebanon | 98.3 /100 | #86 | Exceptional 68.3% |
| Chinese | 98.3 /100 | #87 | Exceptional 68.3% |
| Croatians | 98.2 /100 | #88 | Exceptional 68.3% |
| Ethiopians | 98.2 /100 | #89 | Exceptional 68.3% |
| Icelanders | 98.1 /100 | #90 | Exceptional 68.3% |
| Europeans | 98.1 /100 | #91 | Exceptional 68.2% |
| Luxembourgers | 98.1 /100 | #92 | Exceptional 68.2% |
| Romanians | 97.9 /100 | #93 | Exceptional 68.2% |
| Armenians | 97.7 /100 | #94 | Exceptional 68.1% |
| Immigrants | Pakistan | 97.5 /100 | #95 | Exceptional 68.0% |
| Jordanians | 97.4 /100 | #96 | Exceptional 68.0% |
Demographics Similar to Immigrants from Middle Africa by College, Under 1 year
In terms of college, under 1 year, the demographic groups most similar to Immigrants from Middle Africa are Native Hawaiian (63.9%, a difference of 0.010%), Ghanaian (63.9%, a difference of 0.080%), Puget Sound Salish (63.9%, a difference of 0.090%), Immigrants from Vietnam (64.0%, a difference of 0.18%), and Immigrants from South America (63.8%, a difference of 0.18%).
| Demographics | Rating | Rank | College, Under 1 year |
| Peruvians | 13.7 /100 | #205 | Poor 64.1% |
| Whites/Caucasians | 12.8 /100 | #206 | Poor 64.0% |
| Colombians | 12.4 /100 | #207 | Poor 64.0% |
| Immigrants | Vietnam | 12.1 /100 | #208 | Poor 64.0% |
| Puget Sound Salish | 11.3 /100 | #209 | Poor 63.9% |
| Ghanaians | 11.2 /100 | #210 | Poor 63.9% |
| Native Hawaiians | 10.6 /100 | #211 | Poor 63.9% |
| Immigrants | Middle Africa | 10.5 /100 | #212 | Poor 63.9% |
| Immigrants | South America | 9.1 /100 | #213 | Tragic 63.8% |
| Immigrants | Nigeria | 8.8 /100 | #214 | Tragic 63.7% |
| Senegalese | 7.7 /100 | #215 | Tragic 63.6% |
| Hmong | 6.8 /100 | #216 | Tragic 63.5% |
| Immigrants | Uruguay | 5.8 /100 | #217 | Tragic 63.4% |
| Immigrants | Panama | 5.7 /100 | #218 | Tragic 63.4% |
| Immigrants | Fiji | 5.7 /100 | #219 | Tragic 63.4% |