Ethiopian vs Immigrants from Armenia Male Disability
COMPARE
Ethiopian
Immigrants from Armenia
Male Disability
Male Disability Comparison
Ethiopians
Immigrants from Armenia
10.2%
MALE DISABILITY
99.8/ 100
METRIC RATING
36th/ 347
METRIC RANK
10.7%
MALE DISABILITY
96.6/ 100
METRIC RATING
97th/ 347
METRIC RANK
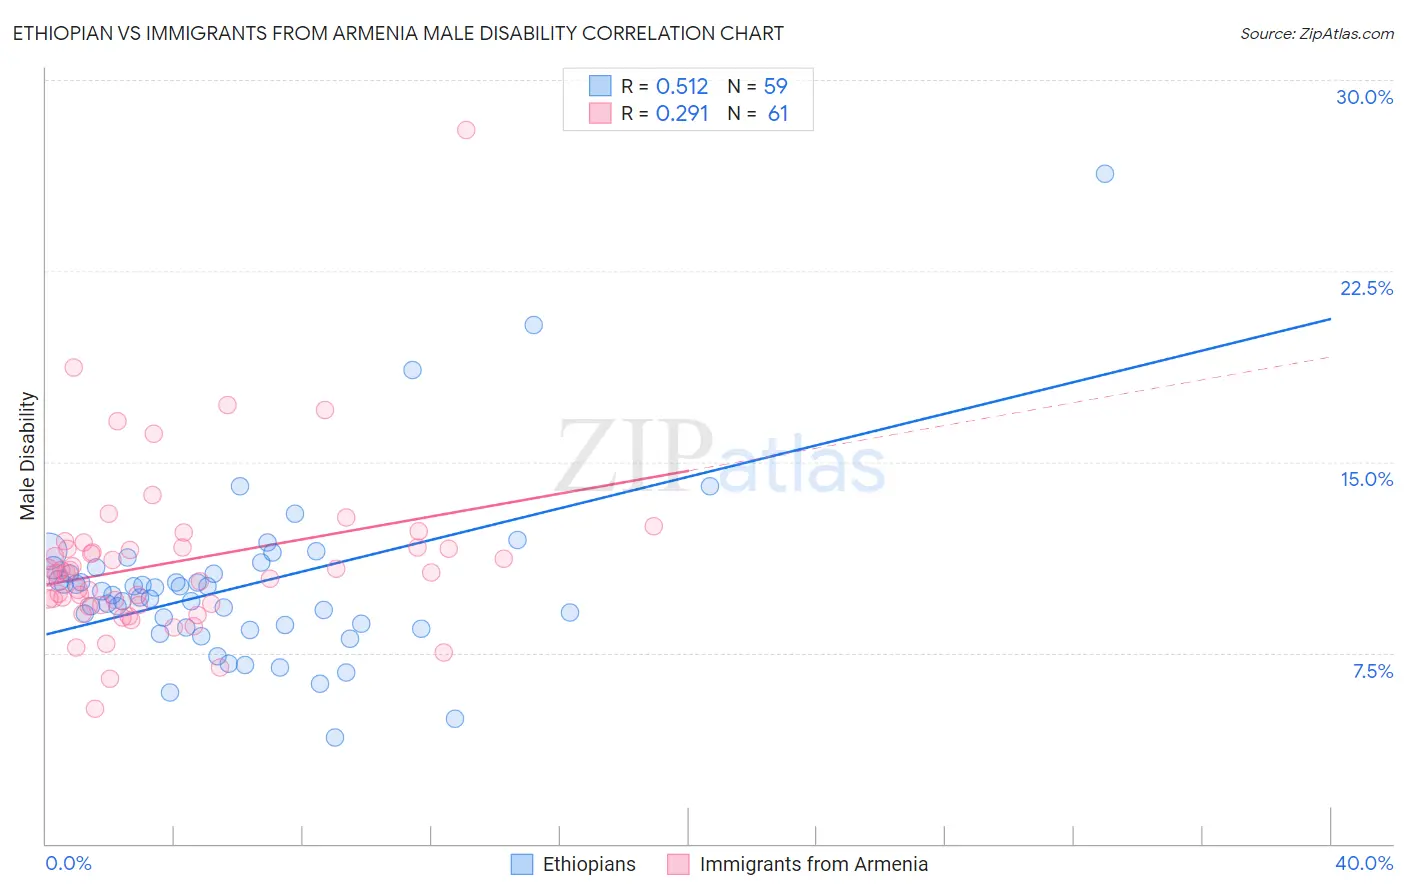
Ethiopian vs Immigrants from Armenia Male Disability Correlation Chart
The statistical analysis conducted on geographies consisting of 223,232,754 people shows a substantial positive correlation between the proportion of Ethiopians and percentage of males with a disability in the United States with a correlation coefficient (R) of 0.512 and weighted average of 10.2%. Similarly, the statistical analysis conducted on geographies consisting of 97,710,322 people shows a weak positive correlation between the proportion of Immigrants from Armenia and percentage of males with a disability in the United States with a correlation coefficient (R) of 0.291 and weighted average of 10.7%, a difference of 4.8%.
Male Disability Correlation Summary
| Measurement | Ethiopian | Immigrants from Armenia |
| Minimum | 4.2% | 5.3% |
| Maximum | 26.3% | 28.0% |
| Range | 22.2% | 22.8% |
| Mean | 10.1% | 11.1% |
| Median | 9.8% | 10.6% |
| Interquartile 25% (IQ1) | 8.5% | 9.4% |
| Interquartile 75% (IQ3) | 10.8% | 11.6% |
| Interquartile Range (IQR) | 2.3% | 2.3% |
| Standard Deviation (Sample) | 3.4% | 3.3% |
| Standard Deviation (Population) | 3.4% | 3.3% |
Similar Demographics by Male Disability
Demographics Similar to Ethiopians by Male Disability
In terms of male disability, the demographic groups most similar to Ethiopians are Immigrants from Argentina (10.2%, a difference of 0.050%), Immigrants from Indonesia (10.2%, a difference of 0.070%), Immigrants from Turkey (10.2%, a difference of 0.16%), Immigrants from Ethiopia (10.2%, a difference of 0.22%), and Immigrants from Kuwait (10.2%, a difference of 0.24%).
| Demographics | Rating | Rank | Male Disability |
| Venezuelans | 99.9 /100 | #29 | Exceptional 10.1% |
| Immigrants | Egypt | 99.9 /100 | #30 | Exceptional 10.1% |
| Soviet Union | 99.9 /100 | #31 | Exceptional 10.1% |
| Argentineans | 99.9 /100 | #32 | Exceptional 10.1% |
| Immigrants | Ethiopia | 99.9 /100 | #33 | Exceptional 10.2% |
| Immigrants | Turkey | 99.9 /100 | #34 | Exceptional 10.2% |
| Immigrants | Argentina | 99.9 /100 | #35 | Exceptional 10.2% |
| Ethiopians | 99.8 /100 | #36 | Exceptional 10.2% |
| Immigrants | Indonesia | 99.8 /100 | #37 | Exceptional 10.2% |
| Immigrants | Kuwait | 99.8 /100 | #38 | Exceptional 10.2% |
| Afghans | 99.8 /100 | #39 | Exceptional 10.2% |
| Immigrants | Nepal | 99.8 /100 | #40 | Exceptional 10.3% |
| Taiwanese | 99.8 /100 | #41 | Exceptional 10.3% |
| Mongolians | 99.7 /100 | #42 | Exceptional 10.3% |
| Immigrants | Bangladesh | 99.7 /100 | #43 | Exceptional 10.3% |
Demographics Similar to Immigrants from Armenia by Male Disability
In terms of male disability, the demographic groups most similar to Immigrants from Armenia are Nicaraguan (10.7%, a difference of 0.020%), Immigrants from Romania (10.7%, a difference of 0.060%), Chilean (10.7%, a difference of 0.12%), Immigrants from Sweden (10.7%, a difference of 0.15%), and Immigrants from Switzerland (10.7%, a difference of 0.20%).
| Demographics | Rating | Rank | Male Disability |
| Immigrants | Morocco | 97.7 /100 | #90 | Exceptional 10.6% |
| Immigrants | France | 97.6 /100 | #91 | Exceptional 10.6% |
| Palestinians | 97.4 /100 | #92 | Exceptional 10.7% |
| Immigrants | St. Vincent and the Grenadines | 97.1 /100 | #93 | Exceptional 10.7% |
| Immigrants | Sweden | 96.9 /100 | #94 | Exceptional 10.7% |
| Chileans | 96.9 /100 | #95 | Exceptional 10.7% |
| Nicaraguans | 96.6 /100 | #96 | Exceptional 10.7% |
| Immigrants | Armenia | 96.6 /100 | #97 | Exceptional 10.7% |
| Immigrants | Romania | 96.5 /100 | #98 | Exceptional 10.7% |
| Immigrants | Switzerland | 96.1 /100 | #99 | Exceptional 10.7% |
| Immigrants | Kazakhstan | 95.9 /100 | #100 | Exceptional 10.7% |
| Immigrants | Greece | 95.6 /100 | #101 | Exceptional 10.7% |
| Immigrants | Eastern Europe | 95.3 /100 | #102 | Exceptional 10.7% |
| Uruguayans | 95.3 /100 | #103 | Exceptional 10.7% |
| Immigrants | Nigeria | 95.1 /100 | #104 | Exceptional 10.8% |