Jordanian vs Immigrants from Germany Male Disability
COMPARE
Jordanian
Immigrants from Germany
Male Disability
Male Disability Comparison
Jordanians
Immigrants from Germany
10.5%
MALE DISABILITY
99.3/ 100
METRIC RATING
64th/ 347
METRIC RANK
12.3%
MALE DISABILITY
0.1/ 100
METRIC RATING
267th/ 347
METRIC RANK
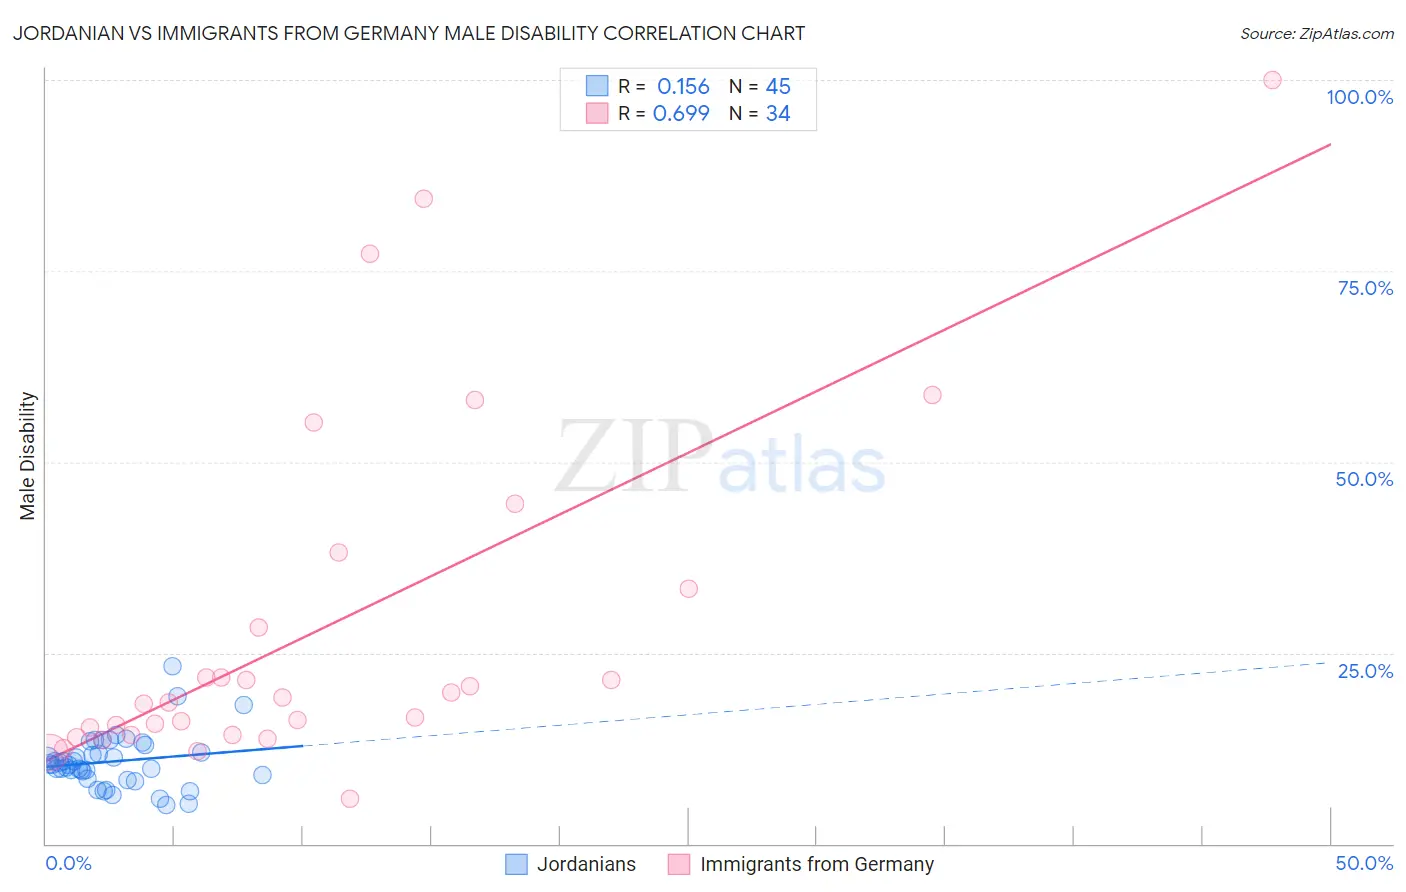
Jordanian vs Immigrants from Germany Male Disability Correlation Chart
The statistical analysis conducted on geographies consisting of 166,415,761 people shows a poor positive correlation between the proportion of Jordanians and percentage of males with a disability in the United States with a correlation coefficient (R) of 0.156 and weighted average of 10.5%. Similarly, the statistical analysis conducted on geographies consisting of 463,850,065 people shows a significant positive correlation between the proportion of Immigrants from Germany and percentage of males with a disability in the United States with a correlation coefficient (R) of 0.699 and weighted average of 12.3%, a difference of 17.3%.
Male Disability Correlation Summary
| Measurement | Jordanian | Immigrants from Germany |
| Minimum | 5.0% | 5.9% |
| Maximum | 23.2% | 100.0% |
| Range | 18.1% | 94.1% |
| Mean | 10.8% | 28.5% |
| Median | 10.4% | 18.8% |
| Interquartile 25% (IQ1) | 8.8% | 14.2% |
| Interquartile 75% (IQ3) | 12.4% | 33.3% |
| Interquartile Range (IQR) | 3.6% | 19.1% |
| Standard Deviation (Sample) | 3.5% | 23.0% |
| Standard Deviation (Population) | 3.5% | 22.7% |
Similar Demographics by Male Disability
Demographics Similar to Jordanians by Male Disability
In terms of male disability, the demographic groups most similar to Jordanians are Immigrants from Grenada (10.5%, a difference of 0.020%), Guyanese (10.5%, a difference of 0.030%), Immigrants from Afghanistan (10.5%, a difference of 0.030%), Immigrants from Belarus (10.4%, a difference of 0.12%), and Colombian (10.5%, a difference of 0.13%).
| Demographics | Rating | Rank | Male Disability |
| Immigrants | South America | 99.6 /100 | #57 | Exceptional 10.4% |
| Immigrants | Japan | 99.5 /100 | #58 | Exceptional 10.4% |
| Immigrants | Australia | 99.5 /100 | #59 | Exceptional 10.4% |
| Immigrants | Colombia | 99.5 /100 | #60 | Exceptional 10.4% |
| Immigrants | Northern Africa | 99.4 /100 | #61 | Exceptional 10.4% |
| Immigrants | Ecuador | 99.3 /100 | #62 | Exceptional 10.4% |
| Immigrants | Belarus | 99.3 /100 | #63 | Exceptional 10.4% |
| Jordanians | 99.3 /100 | #64 | Exceptional 10.5% |
| Immigrants | Grenada | 99.2 /100 | #65 | Exceptional 10.5% |
| Guyanese | 99.2 /100 | #66 | Exceptional 10.5% |
| Immigrants | Afghanistan | 99.2 /100 | #67 | Exceptional 10.5% |
| Colombians | 99.2 /100 | #68 | Exceptional 10.5% |
| Ecuadorians | 99.2 /100 | #69 | Exceptional 10.5% |
| Immigrants | Bulgaria | 99.1 /100 | #70 | Exceptional 10.5% |
| Immigrants | Cameroon | 99.0 /100 | #71 | Exceptional 10.5% |
Demographics Similar to Immigrants from Germany by Male Disability
In terms of male disability, the demographic groups most similar to Immigrants from Germany are Hawaiian (12.3%, a difference of 0.050%), Immigrants from Portugal (12.3%, a difference of 0.070%), Portuguese (12.3%, a difference of 0.13%), Czechoslovakian (12.3%, a difference of 0.13%), and Spaniard (12.3%, a difference of 0.21%).
| Demographics | Rating | Rank | Male Disability |
| Swedes | 0.3 /100 | #260 | Tragic 12.1% |
| Slavs | 0.2 /100 | #261 | Tragic 12.2% |
| Norwegians | 0.2 /100 | #262 | Tragic 12.2% |
| Canadians | 0.2 /100 | #263 | Tragic 12.2% |
| Nepalese | 0.2 /100 | #264 | Tragic 12.2% |
| Immigrants | Portugal | 0.1 /100 | #265 | Tragic 12.3% |
| Hawaiians | 0.1 /100 | #266 | Tragic 12.3% |
| Immigrants | Germany | 0.1 /100 | #267 | Tragic 12.3% |
| Portuguese | 0.1 /100 | #268 | Tragic 12.3% |
| Czechoslovakians | 0.1 /100 | #269 | Tragic 12.3% |
| Spaniards | 0.1 /100 | #270 | Tragic 12.3% |
| Scandinavians | 0.1 /100 | #271 | Tragic 12.3% |
| Hmong | 0.0 /100 | #272 | Tragic 12.5% |
| Native Hawaiians | 0.0 /100 | #273 | Tragic 12.5% |
| Hopi | 0.0 /100 | #274 | Tragic 12.5% |