Ethiopian vs Iraqi Male Disability
COMPARE
Ethiopian
Iraqi
Male Disability
Male Disability Comparison
Ethiopians
Iraqis
10.2%
MALE DISABILITY
99.8/ 100
METRIC RATING
36th/ 347
METRIC RANK
11.3%
MALE DISABILITY
30.5/ 100
METRIC RATING
184th/ 347
METRIC RANK
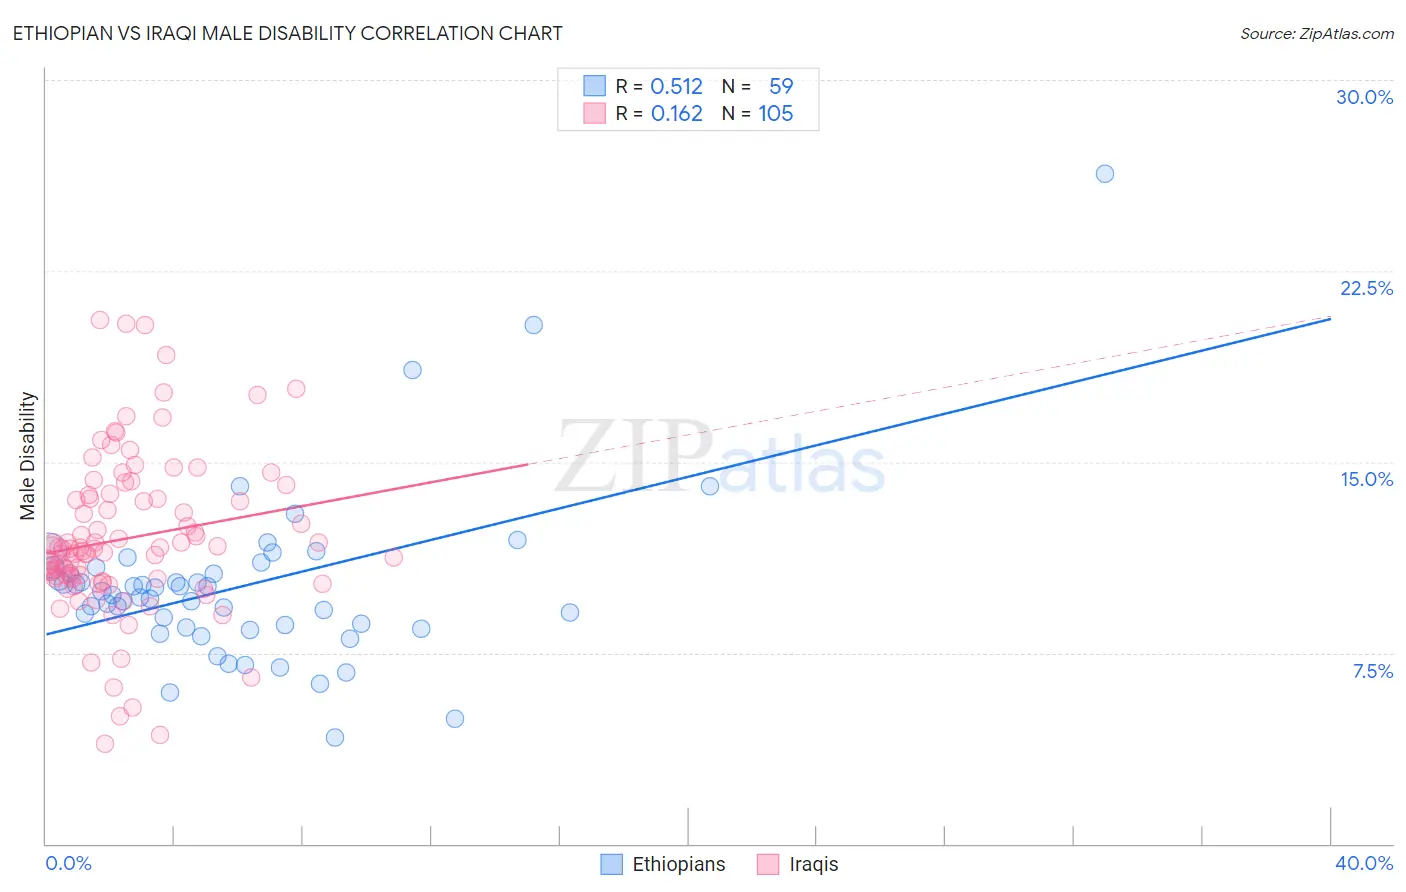
Ethiopian vs Iraqi Male Disability Correlation Chart
The statistical analysis conducted on geographies consisting of 223,232,754 people shows a substantial positive correlation between the proportion of Ethiopians and percentage of males with a disability in the United States with a correlation coefficient (R) of 0.512 and weighted average of 10.2%. Similarly, the statistical analysis conducted on geographies consisting of 170,656,152 people shows a poor positive correlation between the proportion of Iraqis and percentage of males with a disability in the United States with a correlation coefficient (R) of 0.162 and weighted average of 11.3%, a difference of 11.1%.
Male Disability Correlation Summary
| Measurement | Ethiopian | Iraqi |
| Minimum | 4.2% | 3.9% |
| Maximum | 26.3% | 20.6% |
| Range | 22.2% | 16.7% |
| Mean | 10.1% | 12.0% |
| Median | 9.8% | 11.6% |
| Interquartile 25% (IQ1) | 8.5% | 10.4% |
| Interquartile 75% (IQ3) | 10.8% | 13.6% |
| Interquartile Range (IQR) | 2.3% | 3.2% |
| Standard Deviation (Sample) | 3.4% | 3.1% |
| Standard Deviation (Population) | 3.4% | 3.1% |
Similar Demographics by Male Disability
Demographics Similar to Ethiopians by Male Disability
In terms of male disability, the demographic groups most similar to Ethiopians are Immigrants from Argentina (10.2%, a difference of 0.050%), Immigrants from Indonesia (10.2%, a difference of 0.070%), Immigrants from Turkey (10.2%, a difference of 0.16%), Immigrants from Ethiopia (10.2%, a difference of 0.22%), and Immigrants from Kuwait (10.2%, a difference of 0.24%).
| Demographics | Rating | Rank | Male Disability |
| Venezuelans | 99.9 /100 | #29 | Exceptional 10.1% |
| Immigrants | Egypt | 99.9 /100 | #30 | Exceptional 10.1% |
| Soviet Union | 99.9 /100 | #31 | Exceptional 10.1% |
| Argentineans | 99.9 /100 | #32 | Exceptional 10.1% |
| Immigrants | Ethiopia | 99.9 /100 | #33 | Exceptional 10.2% |
| Immigrants | Turkey | 99.9 /100 | #34 | Exceptional 10.2% |
| Immigrants | Argentina | 99.9 /100 | #35 | Exceptional 10.2% |
| Ethiopians | 99.8 /100 | #36 | Exceptional 10.2% |
| Immigrants | Indonesia | 99.8 /100 | #37 | Exceptional 10.2% |
| Immigrants | Kuwait | 99.8 /100 | #38 | Exceptional 10.2% |
| Afghans | 99.8 /100 | #39 | Exceptional 10.2% |
| Immigrants | Nepal | 99.8 /100 | #40 | Exceptional 10.3% |
| Taiwanese | 99.8 /100 | #41 | Exceptional 10.3% |
| Mongolians | 99.7 /100 | #42 | Exceptional 10.3% |
| Immigrants | Bangladesh | 99.7 /100 | #43 | Exceptional 10.3% |
Demographics Similar to Iraqis by Male Disability
In terms of male disability, the demographic groups most similar to Iraqis are Pakistani (11.3%, a difference of 0.010%), Immigrants from Central America (11.3%, a difference of 0.15%), Immigrants from Zaire (11.4%, a difference of 0.19%), Immigrants from Belize (11.3%, a difference of 0.20%), and Immigrants from Austria (11.4%, a difference of 0.21%).
| Demographics | Rating | Rank | Male Disability |
| Immigrants | Norway | 44.2 /100 | #177 | Average 11.3% |
| Australians | 42.2 /100 | #178 | Average 11.3% |
| Immigrants | Caribbean | 41.4 /100 | #179 | Average 11.3% |
| Hondurans | 41.1 /100 | #180 | Average 11.3% |
| Immigrants | Senegal | 34.4 /100 | #181 | Fair 11.3% |
| Immigrants | Belize | 33.7 /100 | #182 | Fair 11.3% |
| Immigrants | Central America | 32.9 /100 | #183 | Fair 11.3% |
| Iraqis | 30.5 /100 | #184 | Fair 11.3% |
| Pakistanis | 30.3 /100 | #185 | Fair 11.3% |
| Immigrants | Zaire | 27.6 /100 | #186 | Fair 11.4% |
| Immigrants | Austria | 27.3 /100 | #187 | Fair 11.4% |
| Estonians | 26.8 /100 | #188 | Fair 11.4% |
| Immigrants | Netherlands | 25.9 /100 | #189 | Fair 11.4% |
| Immigrants | Bosnia and Herzegovina | 25.4 /100 | #190 | Fair 11.4% |
| Senegalese | 23.2 /100 | #191 | Fair 11.4% |