Cherokee vs Immigrants from Ireland Ambulatory Disability
COMPARE
Cherokee
Immigrants from Ireland
Ambulatory Disability
Ambulatory Disability Comparison
Cherokee
Immigrants from Ireland
7.9%
AMBULATORY DISABILITY
0.0/ 100
METRIC RATING
333rd/ 347
METRIC RANK
5.7%
AMBULATORY DISABILITY
99.2/ 100
METRIC RATING
80th/ 347
METRIC RANK
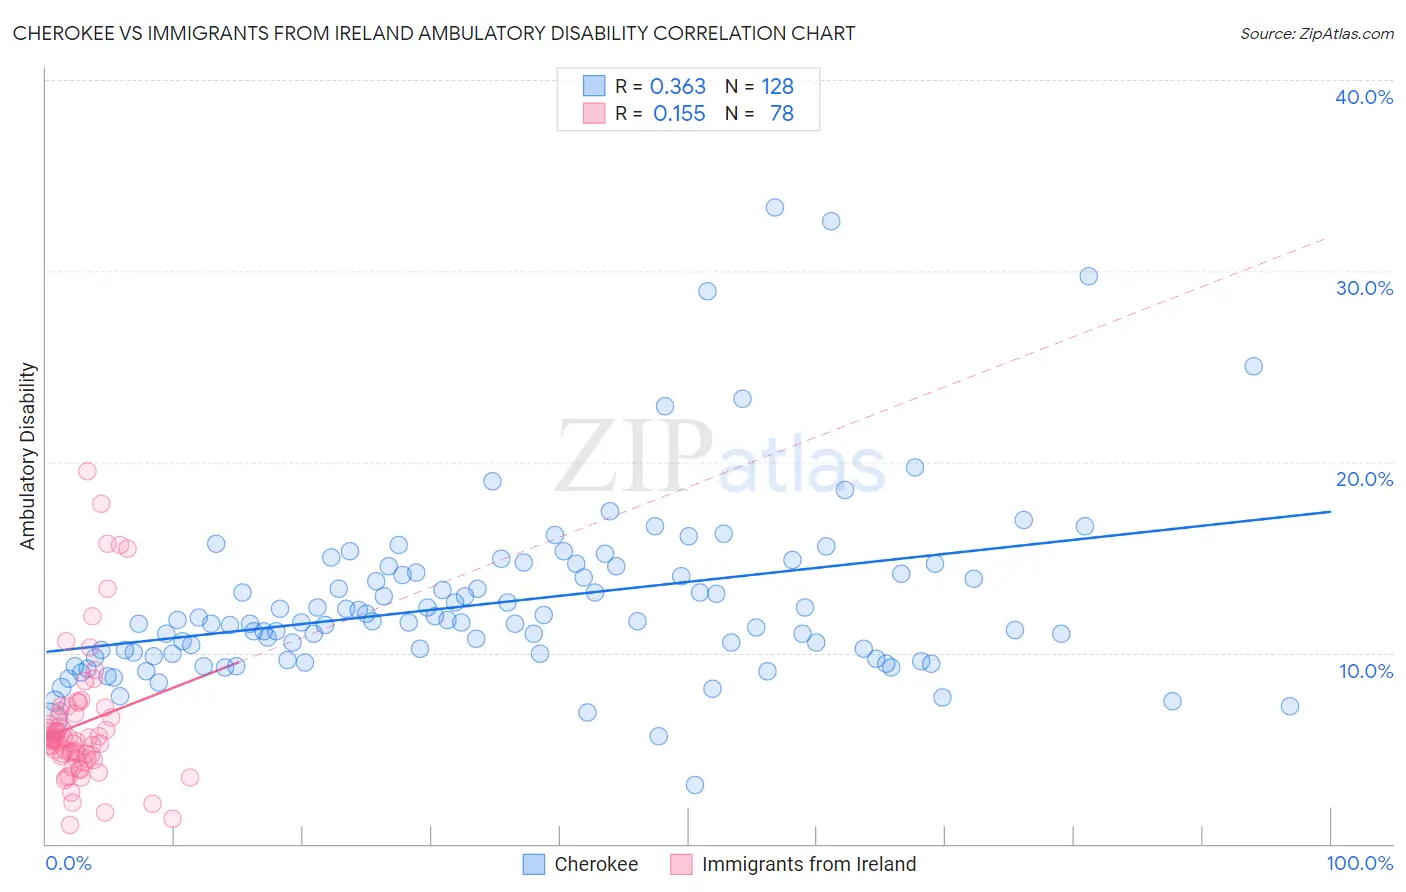
Cherokee vs Immigrants from Ireland Ambulatory Disability Correlation Chart
The statistical analysis conducted on geographies consisting of 493,453,063 people shows a mild positive correlation between the proportion of Cherokee and percentage of population with ambulatory disability in the United States with a correlation coefficient (R) of 0.363 and weighted average of 7.9%. Similarly, the statistical analysis conducted on geographies consisting of 240,763,505 people shows a poor positive correlation between the proportion of Immigrants from Ireland and percentage of population with ambulatory disability in the United States with a correlation coefficient (R) of 0.155 and weighted average of 5.7%, a difference of 37.4%.
Ambulatory Disability Correlation Summary
| Measurement | Cherokee | Immigrants from Ireland |
| Minimum | 3.1% | 0.96% |
| Maximum | 33.3% | 19.5% |
| Range | 30.2% | 18.6% |
| Mean | 12.6% | 6.2% |
| Median | 11.6% | 5.5% |
| Interquartile 25% (IQ1) | 9.9% | 4.6% |
| Interquartile 75% (IQ3) | 14.2% | 6.8% |
| Interquartile Range (IQR) | 4.3% | 2.3% |
| Standard Deviation (Sample) | 4.7% | 3.5% |
| Standard Deviation (Population) | 4.7% | 3.5% |
Similar Demographics by Ambulatory Disability
Demographics Similar to Cherokee by Ambulatory Disability
In terms of ambulatory disability, the demographic groups most similar to Cherokee are Menominee (7.8%, a difference of 0.89%), Yuman (7.9%, a difference of 0.94%), Cajun (7.8%, a difference of 1.2%), Chickasaw (8.0%, a difference of 2.1%), and Seminole (8.0%, a difference of 2.1%).
| Demographics | Rating | Rank | Ambulatory Disability |
| Blacks/African Americans | 0.0 /100 | #326 | Tragic 7.5% |
| Natives/Alaskans | 0.0 /100 | #327 | Tragic 7.5% |
| Hopi | 0.0 /100 | #328 | Tragic 7.6% |
| Pueblo | 0.0 /100 | #329 | Tragic 7.6% |
| Paiute | 0.0 /100 | #330 | Tragic 7.7% |
| Cajuns | 0.0 /100 | #331 | Tragic 7.8% |
| Menominee | 0.0 /100 | #332 | Tragic 7.8% |
| Cherokee | 0.0 /100 | #333 | Tragic 7.9% |
| Yuman | 0.0 /100 | #334 | Tragic 7.9% |
| Chickasaw | 0.0 /100 | #335 | Tragic 8.0% |
| Seminole | 0.0 /100 | #336 | Tragic 8.0% |
| Dutch West Indians | 0.0 /100 | #337 | Tragic 8.2% |
| Colville | 0.0 /100 | #338 | Tragic 8.2% |
| Pima | 0.0 /100 | #339 | Tragic 8.2% |
| Choctaw | 0.0 /100 | #340 | Tragic 8.3% |
Demographics Similar to Immigrants from Ireland by Ambulatory Disability
In terms of ambulatory disability, the demographic groups most similar to Immigrants from Ireland are Immigrants from Jordan (5.7%, a difference of 0.010%), Palestinian (5.7%, a difference of 0.010%), Eastern European (5.7%, a difference of 0.030%), Ugandan (5.7%, a difference of 0.030%), and Chilean (5.7%, a difference of 0.13%).
| Demographics | Rating | Rank | Ambulatory Disability |
| Immigrants | Northern Africa | 99.4 /100 | #73 | Exceptional 5.7% |
| Immigrants | Cameroon | 99.4 /100 | #74 | Exceptional 5.7% |
| Immigrants | South Africa | 99.3 /100 | #75 | Exceptional 5.7% |
| Sudanese | 99.3 /100 | #76 | Exceptional 5.7% |
| Immigrants | Vietnam | 99.3 /100 | #77 | Exceptional 5.7% |
| Somalis | 99.2 /100 | #78 | Exceptional 5.7% |
| Chileans | 99.2 /100 | #79 | Exceptional 5.7% |
| Immigrants | Ireland | 99.2 /100 | #80 | Exceptional 5.7% |
| Immigrants | Jordan | 99.2 /100 | #81 | Exceptional 5.7% |
| Palestinians | 99.2 /100 | #82 | Exceptional 5.7% |
| Eastern Europeans | 99.2 /100 | #83 | Exceptional 5.7% |
| Ugandans | 99.2 /100 | #84 | Exceptional 5.7% |
| South Americans | 99.0 /100 | #85 | Exceptional 5.7% |
| Latvians | 99.0 /100 | #86 | Exceptional 5.7% |
| Immigrants | Chile | 98.9 /100 | #87 | Exceptional 5.8% |