Subsaharan African vs Immigrants from Ireland Ambulatory Disability
COMPARE
Subsaharan African
Immigrants from Ireland
Ambulatory Disability
Ambulatory Disability Comparison
Sub-Saharan Africans
Immigrants from Ireland
6.4%
AMBULATORY DISABILITY
2.3/ 100
METRIC RATING
233rd/ 347
METRIC RANK
5.7%
AMBULATORY DISABILITY
99.2/ 100
METRIC RATING
80th/ 347
METRIC RANK
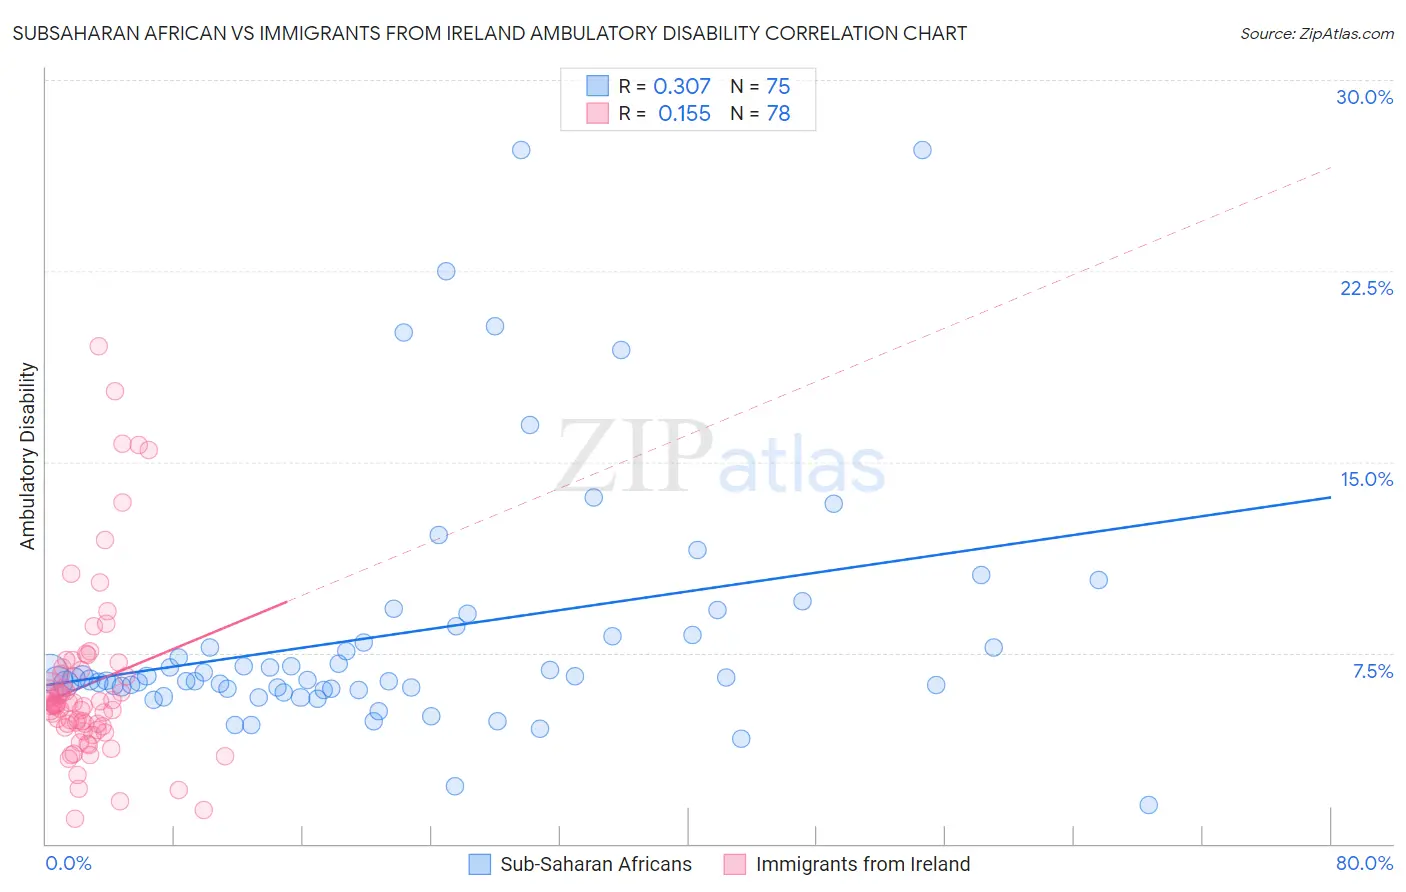
Subsaharan African vs Immigrants from Ireland Ambulatory Disability Correlation Chart
The statistical analysis conducted on geographies consisting of 507,846,771 people shows a mild positive correlation between the proportion of Sub-Saharan Africans and percentage of population with ambulatory disability in the United States with a correlation coefficient (R) of 0.307 and weighted average of 6.4%. Similarly, the statistical analysis conducted on geographies consisting of 240,763,505 people shows a poor positive correlation between the proportion of Immigrants from Ireland and percentage of population with ambulatory disability in the United States with a correlation coefficient (R) of 0.155 and weighted average of 5.7%, a difference of 12.1%.
Ambulatory Disability Correlation Summary
| Measurement | Subsaharan African | Immigrants from Ireland |
| Minimum | 1.5% | 0.96% |
| Maximum | 27.3% | 19.5% |
| Range | 25.7% | 18.6% |
| Mean | 8.3% | 6.2% |
| Median | 6.5% | 5.5% |
| Interquartile 25% (IQ1) | 6.1% | 4.6% |
| Interquartile 75% (IQ3) | 8.2% | 6.8% |
| Interquartile Range (IQR) | 2.1% | 2.3% |
| Standard Deviation (Sample) | 5.0% | 3.5% |
| Standard Deviation (Population) | 4.9% | 3.5% |
Similar Demographics by Ambulatory Disability
Demographics Similar to Sub-Saharan Africans by Ambulatory Disability
In terms of ambulatory disability, the demographic groups most similar to Sub-Saharan Africans are Immigrants from Liberia (6.4%, a difference of 0.030%), Assyrian/Chaldean/Syriac (6.4%, a difference of 0.060%), Hispanic or Latino (6.4%, a difference of 0.060%), Dutch (6.4%, a difference of 0.21%), and Immigrants from Germany (6.4%, a difference of 0.30%).
| Demographics | Rating | Rank | Ambulatory Disability |
| Slavs | 5.1 /100 | #226 | Tragic 6.4% |
| Cubans | 4.0 /100 | #227 | Tragic 6.4% |
| Portuguese | 4.0 /100 | #228 | Tragic 6.4% |
| Czechoslovakians | 3.8 /100 | #229 | Tragic 6.4% |
| Mexicans | 3.5 /100 | #230 | Tragic 6.4% |
| Panamanians | 3.1 /100 | #231 | Tragic 6.4% |
| Assyrians/Chaldeans/Syriacs | 2.4 /100 | #232 | Tragic 6.4% |
| Sub-Saharan Africans | 2.3 /100 | #233 | Tragic 6.4% |
| Immigrants | Liberia | 2.3 /100 | #234 | Tragic 6.4% |
| Hispanics or Latinos | 2.2 /100 | #235 | Tragic 6.4% |
| Dutch | 2.0 /100 | #236 | Tragic 6.4% |
| Immigrants | Germany | 1.8 /100 | #237 | Tragic 6.4% |
| Haitians | 1.8 /100 | #238 | Tragic 6.4% |
| Senegalese | 1.7 /100 | #239 | Tragic 6.4% |
| Immigrants | Senegal | 1.7 /100 | #240 | Tragic 6.4% |
Demographics Similar to Immigrants from Ireland by Ambulatory Disability
In terms of ambulatory disability, the demographic groups most similar to Immigrants from Ireland are Immigrants from Jordan (5.7%, a difference of 0.010%), Palestinian (5.7%, a difference of 0.010%), Eastern European (5.7%, a difference of 0.030%), Ugandan (5.7%, a difference of 0.030%), and Chilean (5.7%, a difference of 0.13%).
| Demographics | Rating | Rank | Ambulatory Disability |
| Immigrants | Northern Africa | 99.4 /100 | #73 | Exceptional 5.7% |
| Immigrants | Cameroon | 99.4 /100 | #74 | Exceptional 5.7% |
| Immigrants | South Africa | 99.3 /100 | #75 | Exceptional 5.7% |
| Sudanese | 99.3 /100 | #76 | Exceptional 5.7% |
| Immigrants | Vietnam | 99.3 /100 | #77 | Exceptional 5.7% |
| Somalis | 99.2 /100 | #78 | Exceptional 5.7% |
| Chileans | 99.2 /100 | #79 | Exceptional 5.7% |
| Immigrants | Ireland | 99.2 /100 | #80 | Exceptional 5.7% |
| Immigrants | Jordan | 99.2 /100 | #81 | Exceptional 5.7% |
| Palestinians | 99.2 /100 | #82 | Exceptional 5.7% |
| Eastern Europeans | 99.2 /100 | #83 | Exceptional 5.7% |
| Ugandans | 99.2 /100 | #84 | Exceptional 5.7% |
| South Americans | 99.0 /100 | #85 | Exceptional 5.7% |
| Latvians | 99.0 /100 | #86 | Exceptional 5.7% |
| Immigrants | Chile | 98.9 /100 | #87 | Exceptional 5.8% |