Sioux vs Immigrants from Haiti Ambulatory Disability
COMPARE
Sioux
Immigrants from Haiti
Ambulatory Disability
Ambulatory Disability Comparison
Sioux
Immigrants from Haiti
6.7%
AMBULATORY DISABILITY
0.1/ 100
METRIC RATING
274th/ 347
METRIC RANK
6.5%
AMBULATORY DISABILITY
1.6/ 100
METRIC RATING
241st/ 347
METRIC RANK
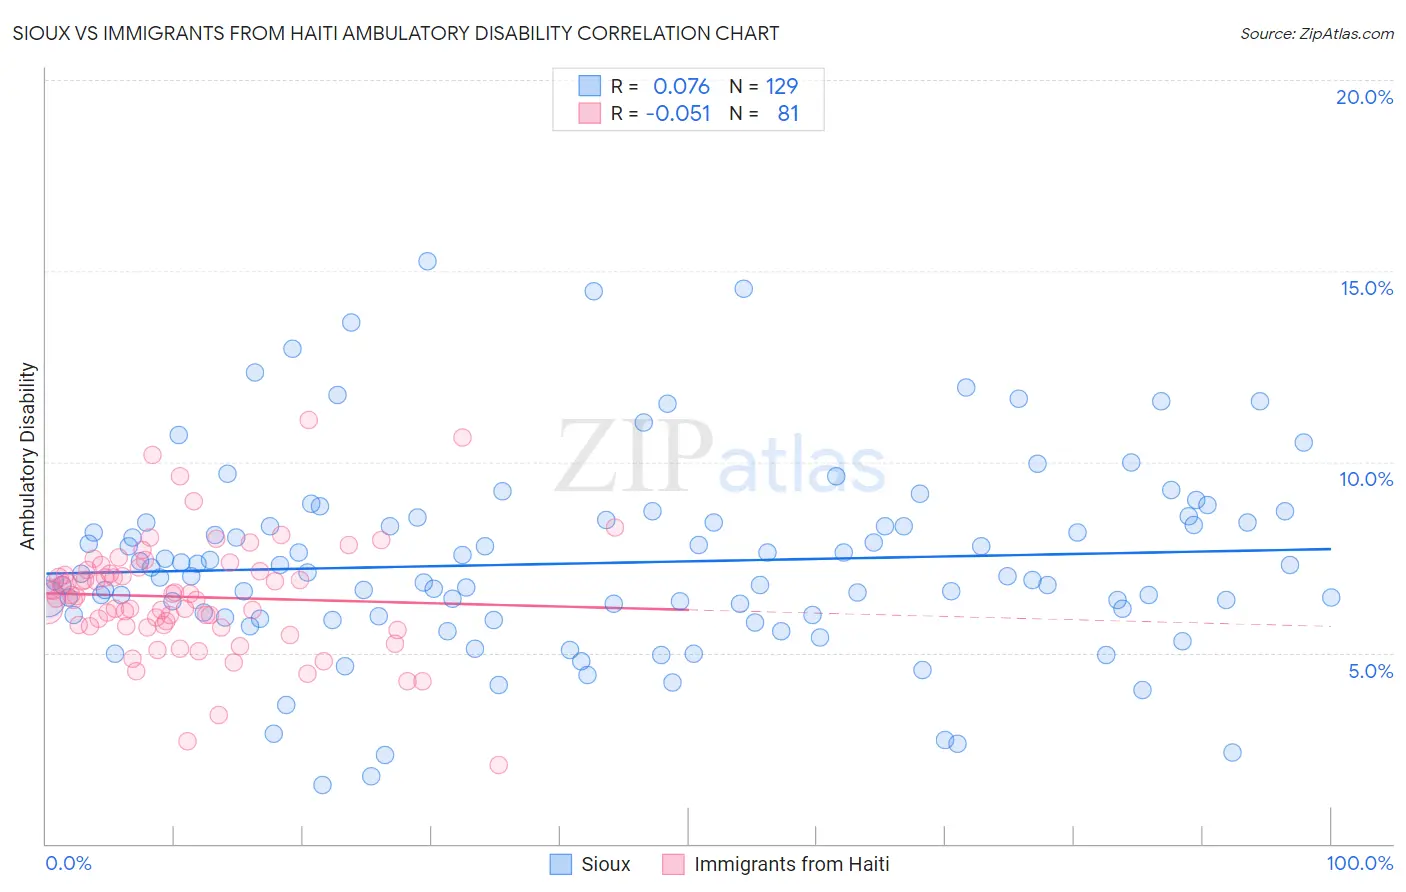
Sioux vs Immigrants from Haiti Ambulatory Disability Correlation Chart
The statistical analysis conducted on geographies consisting of 234,119,186 people shows a slight positive correlation between the proportion of Sioux and percentage of population with ambulatory disability in the United States with a correlation coefficient (R) of 0.076 and weighted average of 6.7%. Similarly, the statistical analysis conducted on geographies consisting of 225,209,570 people shows a slight negative correlation between the proportion of Immigrants from Haiti and percentage of population with ambulatory disability in the United States with a correlation coefficient (R) of -0.051 and weighted average of 6.5%, a difference of 4.0%.
Ambulatory Disability Correlation Summary
| Measurement | Sioux | Immigrants from Haiti |
| Minimum | 1.5% | 2.1% |
| Maximum | 15.2% | 11.1% |
| Range | 13.7% | 9.0% |
| Mean | 7.3% | 6.5% |
| Median | 7.0% | 6.5% |
| Interquartile 25% (IQ1) | 6.0% | 5.7% |
| Interquartile 75% (IQ3) | 8.4% | 7.2% |
| Interquartile Range (IQR) | 2.4% | 1.5% |
| Standard Deviation (Sample) | 2.5% | 1.5% |
| Standard Deviation (Population) | 2.5% | 1.5% |
Similar Demographics by Ambulatory Disability
Demographics Similar to Sioux by Ambulatory Disability
In terms of ambulatory disability, the demographic groups most similar to Sioux are Immigrants from Guyana (6.7%, a difference of 0.060%), Celtic (6.7%, a difference of 0.090%), Jamaican (6.7%, a difference of 0.17%), White/Caucasian (6.7%, a difference of 0.24%), and Immigrants from West Indies (6.7%, a difference of 0.25%).
| Demographics | Rating | Rank | Ambulatory Disability |
| Trinidadians and Tobagonians | 0.2 /100 | #267 | Tragic 6.6% |
| Spanish | 0.2 /100 | #268 | Tragic 6.6% |
| French | 0.1 /100 | #269 | Tragic 6.6% |
| Slovaks | 0.1 /100 | #270 | Tragic 6.7% |
| Immigrants | Trinidad and Tobago | 0.1 /100 | #271 | Tragic 6.7% |
| French Canadians | 0.1 /100 | #272 | Tragic 6.7% |
| Whites/Caucasians | 0.1 /100 | #273 | Tragic 6.7% |
| Sioux | 0.1 /100 | #274 | Tragic 6.7% |
| Immigrants | Guyana | 0.1 /100 | #275 | Tragic 6.7% |
| Celtics | 0.1 /100 | #276 | Tragic 6.7% |
| Jamaicans | 0.1 /100 | #277 | Tragic 6.7% |
| Immigrants | West Indies | 0.1 /100 | #278 | Tragic 6.7% |
| Immigrants | Caribbean | 0.0 /100 | #279 | Tragic 6.7% |
| Pennsylvania Germans | 0.0 /100 | #280 | Tragic 6.8% |
| Yaqui | 0.0 /100 | #281 | Tragic 6.8% |
Demographics Similar to Immigrants from Haiti by Ambulatory Disability
In terms of ambulatory disability, the demographic groups most similar to Immigrants from Haiti are Spaniard (6.5%, a difference of 0.030%), German (6.5%, a difference of 0.050%), Immigrants from Panama (6.5%, a difference of 0.050%), Immigrants from Senegal (6.4%, a difference of 0.080%), and Tlingit-Haida (6.5%, a difference of 0.090%).
| Demographics | Rating | Rank | Ambulatory Disability |
| Immigrants | Liberia | 2.3 /100 | #234 | Tragic 6.4% |
| Hispanics or Latinos | 2.2 /100 | #235 | Tragic 6.4% |
| Dutch | 2.0 /100 | #236 | Tragic 6.4% |
| Immigrants | Germany | 1.8 /100 | #237 | Tragic 6.4% |
| Haitians | 1.8 /100 | #238 | Tragic 6.4% |
| Senegalese | 1.7 /100 | #239 | Tragic 6.4% |
| Immigrants | Senegal | 1.7 /100 | #240 | Tragic 6.4% |
| Immigrants | Haiti | 1.6 /100 | #241 | Tragic 6.5% |
| Spaniards | 1.6 /100 | #242 | Tragic 6.5% |
| Germans | 1.5 /100 | #243 | Tragic 6.5% |
| Immigrants | Panama | 1.5 /100 | #244 | Tragic 6.5% |
| Tlingit-Haida | 1.5 /100 | #245 | Tragic 6.5% |
| Armenians | 1.5 /100 | #246 | Tragic 6.5% |
| Immigrants | Cuba | 1.4 /100 | #247 | Tragic 6.5% |
| Immigrants | Portugal | 1.4 /100 | #248 | Tragic 6.5% |