Immigrants from Korea vs Immigrants from Haiti Ambulatory Disability
COMPARE
Immigrants from Korea
Immigrants from Haiti
Ambulatory Disability
Ambulatory Disability Comparison
Immigrants from Korea
Immigrants from Haiti
5.2%
AMBULATORY DISABILITY
100.0/ 100
METRIC RATING
11th/ 347
METRIC RANK
6.5%
AMBULATORY DISABILITY
1.6/ 100
METRIC RATING
241st/ 347
METRIC RANK
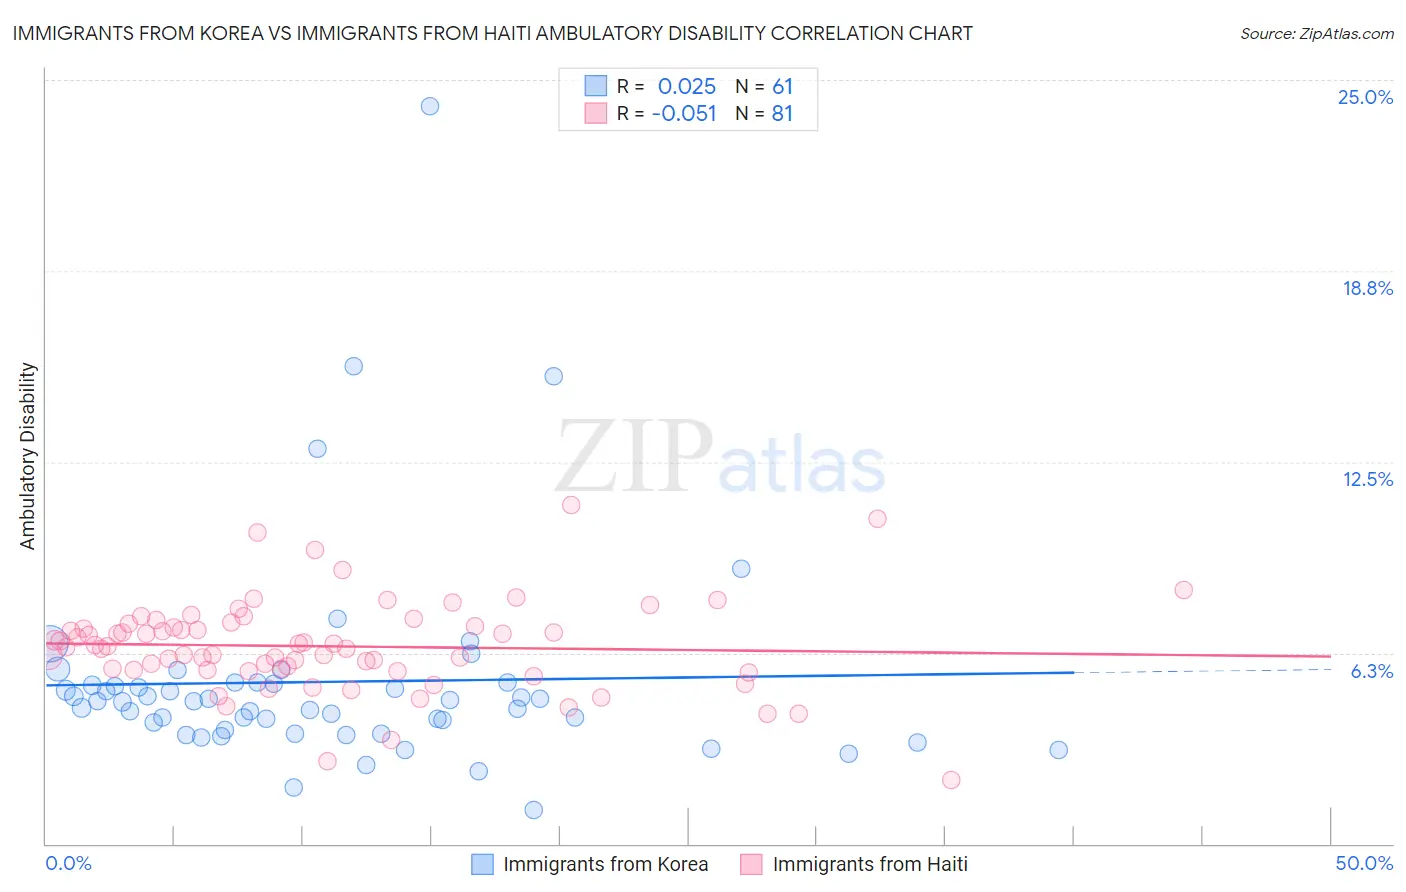
Immigrants from Korea vs Immigrants from Haiti Ambulatory Disability Correlation Chart
The statistical analysis conducted on geographies consisting of 416,118,040 people shows no correlation between the proportion of Immigrants from Korea and percentage of population with ambulatory disability in the United States with a correlation coefficient (R) of 0.025 and weighted average of 5.2%. Similarly, the statistical analysis conducted on geographies consisting of 225,209,570 people shows a slight negative correlation between the proportion of Immigrants from Haiti and percentage of population with ambulatory disability in the United States with a correlation coefficient (R) of -0.051 and weighted average of 6.5%, a difference of 23.1%.
Ambulatory Disability Correlation Summary
| Measurement | Immigrants from Korea | Immigrants from Haiti |
| Minimum | 1.1% | 2.1% |
| Maximum | 24.1% | 11.1% |
| Range | 23.0% | 9.0% |
| Mean | 5.3% | 6.5% |
| Median | 4.6% | 6.5% |
| Interquartile 25% (IQ1) | 3.7% | 5.7% |
| Interquartile 75% (IQ3) | 5.2% | 7.2% |
| Interquartile Range (IQR) | 1.6% | 1.5% |
| Standard Deviation (Sample) | 3.5% | 1.5% |
| Standard Deviation (Population) | 3.5% | 1.5% |
Similar Demographics by Ambulatory Disability
Demographics Similar to Immigrants from Korea by Ambulatory Disability
In terms of ambulatory disability, the demographic groups most similar to Immigrants from Korea are Okinawan (5.3%, a difference of 0.31%), Burmese (5.3%, a difference of 0.81%), Immigrants from Eastern Asia (5.3%, a difference of 0.96%), Immigrants from China (5.3%, a difference of 1.3%), and Yup'ik (5.2%, a difference of 1.6%).
| Demographics | Rating | Rank | Ambulatory Disability |
| Immigrants | Taiwan | 100.0 /100 | #4 | Exceptional 4.9% |
| Immigrants | Singapore | 100.0 /100 | #5 | Exceptional 5.0% |
| Immigrants | Bolivia | 100.0 /100 | #6 | Exceptional 5.0% |
| Bolivians | 100.0 /100 | #7 | Exceptional 5.1% |
| Immigrants | South Central Asia | 100.0 /100 | #8 | Exceptional 5.1% |
| Iranians | 100.0 /100 | #9 | Exceptional 5.1% |
| Yup'ik | 100.0 /100 | #10 | Exceptional 5.2% |
| Immigrants | Korea | 100.0 /100 | #11 | Exceptional 5.2% |
| Okinawans | 100.0 /100 | #12 | Exceptional 5.3% |
| Burmese | 100.0 /100 | #13 | Exceptional 5.3% |
| Immigrants | Eastern Asia | 100.0 /100 | #14 | Exceptional 5.3% |
| Immigrants | China | 100.0 /100 | #15 | Exceptional 5.3% |
| Immigrants | Hong Kong | 100.0 /100 | #16 | Exceptional 5.3% |
| Immigrants | Ethiopia | 100.0 /100 | #17 | Exceptional 5.4% |
| Immigrants | Sri Lanka | 100.0 /100 | #18 | Exceptional 5.4% |
Demographics Similar to Immigrants from Haiti by Ambulatory Disability
In terms of ambulatory disability, the demographic groups most similar to Immigrants from Haiti are Spaniard (6.5%, a difference of 0.030%), German (6.5%, a difference of 0.050%), Immigrants from Panama (6.5%, a difference of 0.050%), Immigrants from Senegal (6.4%, a difference of 0.080%), and Tlingit-Haida (6.5%, a difference of 0.090%).
| Demographics | Rating | Rank | Ambulatory Disability |
| Immigrants | Liberia | 2.3 /100 | #234 | Tragic 6.4% |
| Hispanics or Latinos | 2.2 /100 | #235 | Tragic 6.4% |
| Dutch | 2.0 /100 | #236 | Tragic 6.4% |
| Immigrants | Germany | 1.8 /100 | #237 | Tragic 6.4% |
| Haitians | 1.8 /100 | #238 | Tragic 6.4% |
| Senegalese | 1.7 /100 | #239 | Tragic 6.4% |
| Immigrants | Senegal | 1.7 /100 | #240 | Tragic 6.4% |
| Immigrants | Haiti | 1.6 /100 | #241 | Tragic 6.5% |
| Spaniards | 1.6 /100 | #242 | Tragic 6.5% |
| Germans | 1.5 /100 | #243 | Tragic 6.5% |
| Immigrants | Panama | 1.5 /100 | #244 | Tragic 6.5% |
| Tlingit-Haida | 1.5 /100 | #245 | Tragic 6.5% |
| Armenians | 1.5 /100 | #246 | Tragic 6.5% |
| Immigrants | Cuba | 1.4 /100 | #247 | Tragic 6.5% |
| Immigrants | Portugal | 1.4 /100 | #248 | Tragic 6.5% |