Estonian vs Immigrants from Haiti Unemployment Among Ages 45 to 54 years
COMPARE
Estonian
Immigrants from Haiti
Unemployment Among Ages 45 to 54 years
Unemployment Among Ages 45 to 54 years Comparison
Estonians
Immigrants from Haiti
4.6%
UNEMPLOYMENT AMONG AGES 45 TO 54 YEARS
31.2/ 100
METRIC RATING
196th/ 347
METRIC RANK
5.2%
UNEMPLOYMENT AMONG AGES 45 TO 54 YEARS
0.0/ 100
METRIC RATING
289th/ 347
METRIC RANK
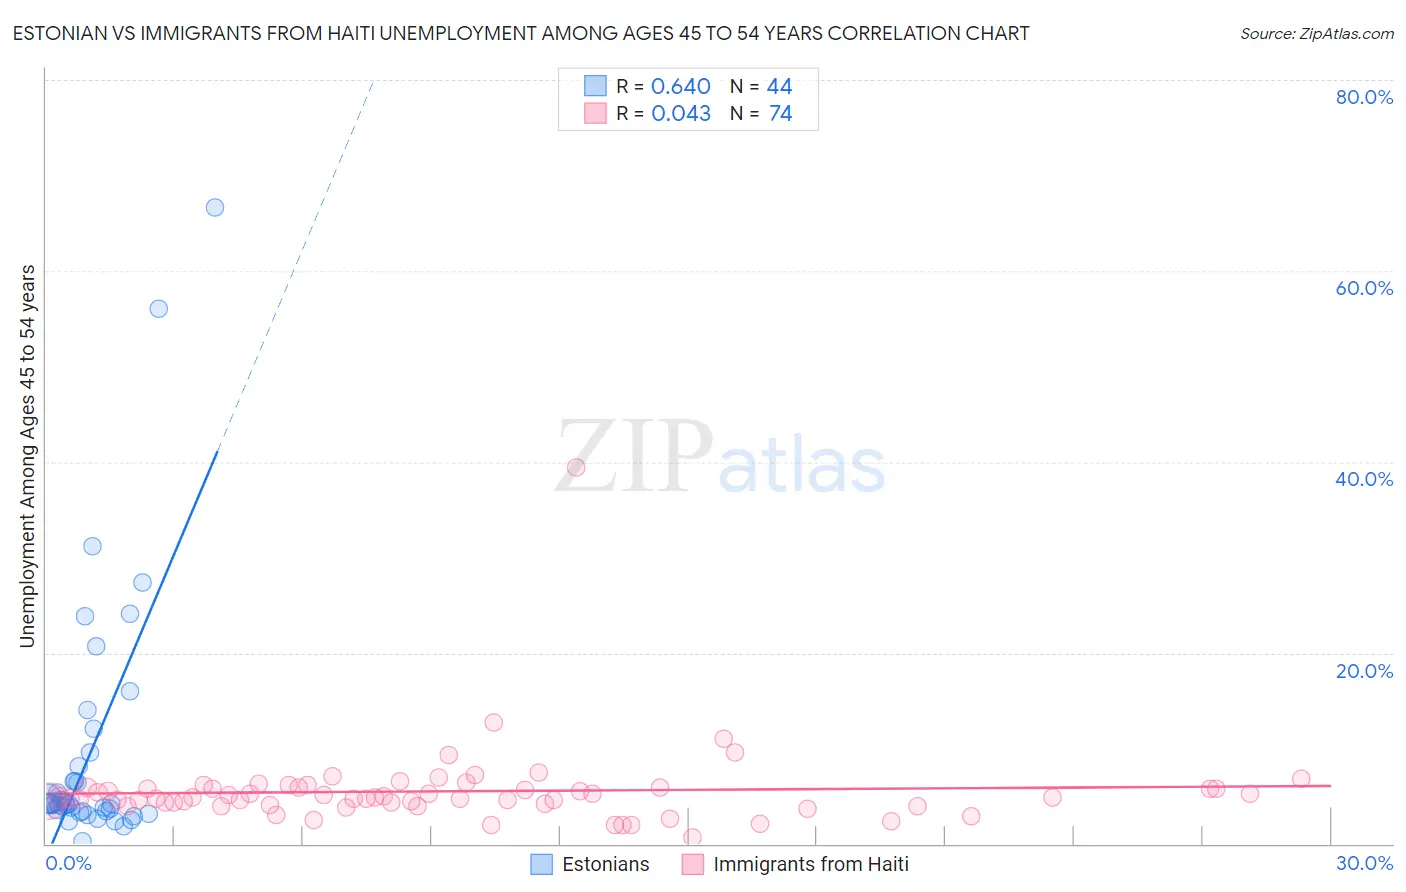
Estonian vs Immigrants from Haiti Unemployment Among Ages 45 to 54 years Correlation Chart
The statistical analysis conducted on geographies consisting of 122,283,099 people shows a significant positive correlation between the proportion of Estonians and unemployment rate among population between the ages 45 and 54 in the United States with a correlation coefficient (R) of 0.640 and weighted average of 4.6%. Similarly, the statistical analysis conducted on geographies consisting of 221,731,051 people shows no correlation between the proportion of Immigrants from Haiti and unemployment rate among population between the ages 45 and 54 in the United States with a correlation coefficient (R) of 0.043 and weighted average of 5.2%, a difference of 13.9%.
Unemployment Among Ages 45 to 54 years Correlation Summary
| Measurement | Estonian | Immigrants from Haiti |
| Minimum | 0.30% | 0.70% |
| Maximum | 66.7% | 39.4% |
| Range | 66.4% | 38.7% |
| Mean | 9.8% | 5.5% |
| Median | 4.2% | 4.8% |
| Interquartile 25% (IQ1) | 3.4% | 4.2% |
| Interquartile 75% (IQ3) | 8.8% | 5.9% |
| Interquartile Range (IQR) | 5.4% | 1.6% |
| Standard Deviation (Sample) | 13.6% | 4.4% |
| Standard Deviation (Population) | 13.4% | 4.4% |
Similar Demographics by Unemployment Among Ages 45 to 54 years
Demographics Similar to Estonians by Unemployment Among Ages 45 to 54 years
In terms of unemployment among ages 45 to 54 years, the demographic groups most similar to Estonians are Albanian (4.6%, a difference of 0.010%), Peruvian (4.6%, a difference of 0.020%), Immigrants from Belarus (4.6%, a difference of 0.030%), South American (4.6%, a difference of 0.090%), and Immigrants from Lithuania (4.6%, a difference of 0.11%).
| Demographics | Rating | Rank | Unemployment Among Ages 45 to 54 years |
| Immigrants | Laos | 35.7 /100 | #189 | Fair 4.6% |
| Immigrants | Serbia | 34.8 /100 | #190 | Fair 4.6% |
| Immigrants | Uruguay | 34.4 /100 | #191 | Fair 4.6% |
| Immigrants | Thailand | 34.1 /100 | #192 | Fair 4.6% |
| Immigrants | Lithuania | 33.2 /100 | #193 | Fair 4.6% |
| South Americans | 32.9 /100 | #194 | Fair 4.6% |
| Peruvians | 31.5 /100 | #195 | Fair 4.6% |
| Estonians | 31.2 /100 | #196 | Fair 4.6% |
| Albanians | 31.1 /100 | #197 | Fair 4.6% |
| Immigrants | Belarus | 30.6 /100 | #198 | Fair 4.6% |
| Brazilians | 20.1 /100 | #199 | Fair 4.6% |
| Immigrants | Denmark | 19.8 /100 | #200 | Poor 4.6% |
| Immigrants | Costa Rica | 19.7 /100 | #201 | Poor 4.6% |
| Immigrants | Peru | 19.1 /100 | #202 | Poor 4.6% |
| Liberians | 18.7 /100 | #203 | Poor 4.6% |
Demographics Similar to Immigrants from Haiti by Unemployment Among Ages 45 to 54 years
In terms of unemployment among ages 45 to 54 years, the demographic groups most similar to Immigrants from Haiti are Immigrants from Portugal (5.2%, a difference of 0.16%), Armenian (5.2%, a difference of 0.17%), Immigrants from Caribbean (5.2%, a difference of 0.39%), Trinidadian and Tobagonian (5.2%, a difference of 0.40%), and Immigrants from Senegal (5.2%, a difference of 0.41%).
| Demographics | Rating | Rank | Unemployment Among Ages 45 to 54 years |
| Africans | 0.0 /100 | #282 | Tragic 5.1% |
| Hispanics or Latinos | 0.0 /100 | #283 | Tragic 5.1% |
| Kiowa | 0.0 /100 | #284 | Tragic 5.1% |
| Iroquois | 0.0 /100 | #285 | Tragic 5.1% |
| Senegalese | 0.0 /100 | #286 | Tragic 5.1% |
| Haitians | 0.0 /100 | #287 | Tragic 5.2% |
| Immigrants | Caribbean | 0.0 /100 | #288 | Tragic 5.2% |
| Immigrants | Haiti | 0.0 /100 | #289 | Tragic 5.2% |
| Immigrants | Portugal | 0.0 /100 | #290 | Tragic 5.2% |
| Armenians | 0.0 /100 | #291 | Tragic 5.2% |
| Trinidadians and Tobagonians | 0.0 /100 | #292 | Tragic 5.2% |
| Immigrants | Senegal | 0.0 /100 | #293 | Tragic 5.2% |
| Belizeans | 0.0 /100 | #294 | Tragic 5.2% |
| Jamaicans | 0.0 /100 | #295 | Tragic 5.3% |
| Aleuts | 0.0 /100 | #296 | Tragic 5.3% |