English vs Assyrian/Chaldean/Syriac Disability Age Under 5
COMPARE
English
Assyrian/Chaldean/Syriac
Disability Age Under 5
Disability Age Under 5 Comparison
English
Assyrians/Chaldeans/Syriacs
1.7%
DISABILITY AGE UNDER 5
0.0/ 100
METRIC RATING
311th/ 347
METRIC RANK
1.1%
DISABILITY AGE UNDER 5
99.5/ 100
METRIC RATING
57th/ 347
METRIC RANK
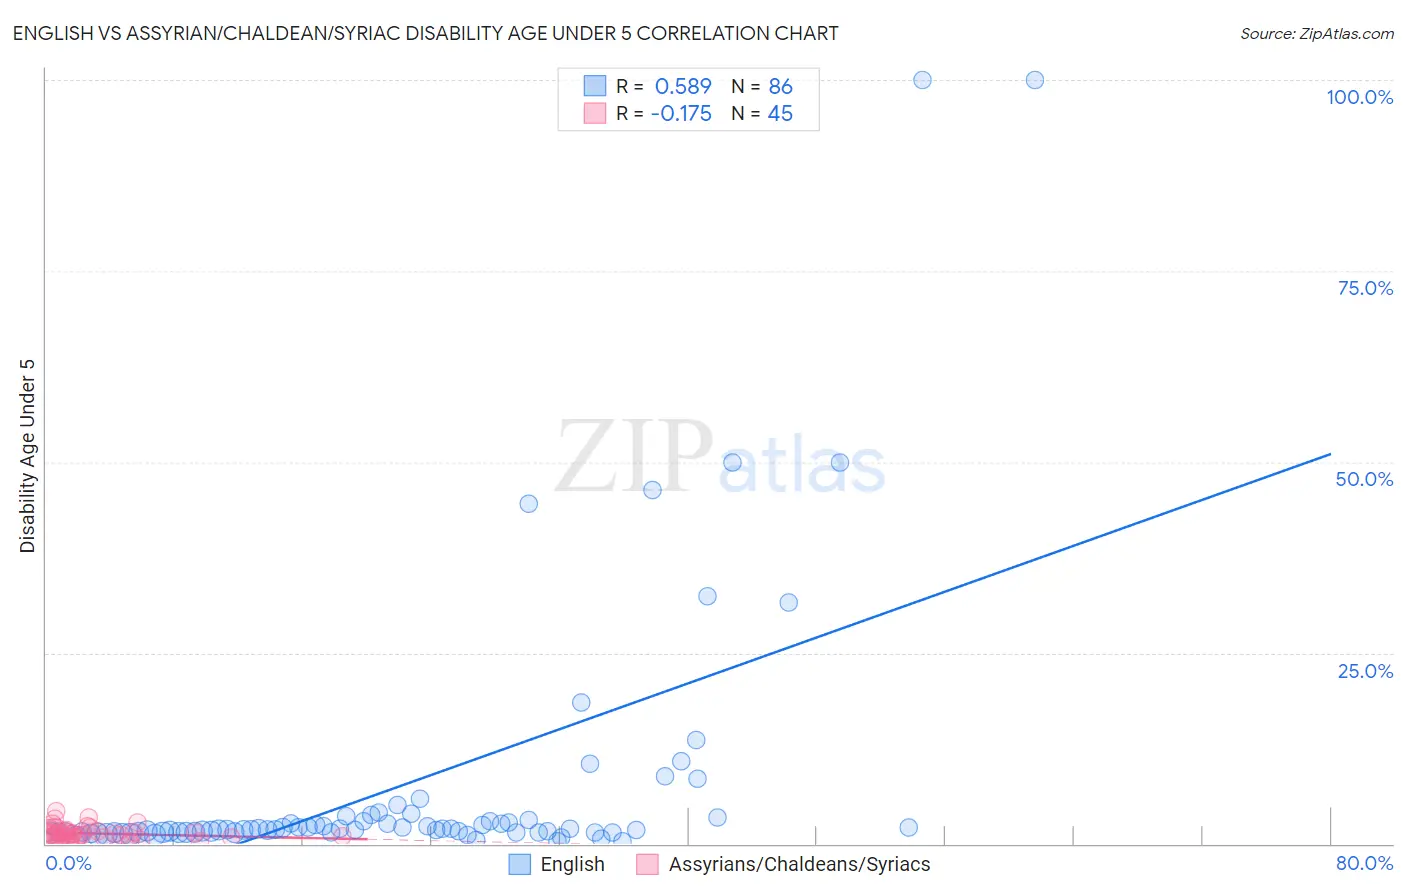
English vs Assyrian/Chaldean/Syriac Disability Age Under 5 Correlation Chart
The statistical analysis conducted on geographies consisting of 261,226,703 people shows a substantial positive correlation between the proportion of English and percentage of population with a disability under the age of 5 in the United States with a correlation coefficient (R) of 0.589 and weighted average of 1.7%. Similarly, the statistical analysis conducted on geographies consisting of 81,585,974 people shows a poor negative correlation between the proportion of Assyrians/Chaldeans/Syriacs and percentage of population with a disability under the age of 5 in the United States with a correlation coefficient (R) of -0.175 and weighted average of 1.1%, a difference of 52.7%.
Disability Age Under 5 Correlation Summary
| Measurement | English | Assyrian/Chaldean/Syriac |
| Minimum | 0.36% | 0.070% |
| Maximum | 100.0% | 4.3% |
| Range | 99.6% | 4.2% |
| Mean | 7.8% | 1.3% |
| Median | 1.9% | 1.1% |
| Interquartile 25% (IQ1) | 1.5% | 0.72% |
| Interquartile 75% (IQ3) | 3.2% | 1.6% |
| Interquartile Range (IQR) | 1.7% | 0.92% |
| Standard Deviation (Sample) | 17.9% | 0.90% |
| Standard Deviation (Population) | 17.8% | 0.89% |
Similar Demographics by Disability Age Under 5
Demographics Similar to English by Disability Age Under 5
In terms of disability age under 5, the demographic groups most similar to English are Puerto Rican (1.7%, a difference of 0.040%), Celtic (1.7%, a difference of 0.20%), Norwegian (1.7%, a difference of 0.36%), White/Caucasian (1.7%, a difference of 0.59%), and Dutch (1.7%, a difference of 0.62%).
| Demographics | Rating | Rank | Disability Age Under 5 |
| Seminole | 0.0 /100 | #304 | Tragic 1.6% |
| Blackfeet | 0.0 /100 | #305 | Tragic 1.6% |
| Creek | 0.0 /100 | #306 | Tragic 1.6% |
| Scottish | 0.0 /100 | #307 | Tragic 1.6% |
| Navajo | 0.0 /100 | #308 | Tragic 1.6% |
| Cape Verdeans | 0.0 /100 | #309 | Tragic 1.7% |
| Whites/Caucasians | 0.0 /100 | #310 | Tragic 1.7% |
| English | 0.0 /100 | #311 | Tragic 1.7% |
| Puerto Ricans | 0.0 /100 | #312 | Tragic 1.7% |
| Celtics | 0.0 /100 | #313 | Tragic 1.7% |
| Norwegians | 0.0 /100 | #314 | Tragic 1.7% |
| Dutch | 0.0 /100 | #315 | Tragic 1.7% |
| Immigrants | Cabo Verde | 0.0 /100 | #316 | Tragic 1.7% |
| French | 0.0 /100 | #317 | Tragic 1.7% |
| Irish | 0.0 /100 | #318 | Tragic 1.7% |
Demographics Similar to Assyrians/Chaldeans/Syriacs by Disability Age Under 5
In terms of disability age under 5, the demographic groups most similar to Assyrians/Chaldeans/Syriacs are Ecuadorian (1.1%, a difference of 0.030%), Immigrants from Egypt (1.1%, a difference of 0.19%), Immigrants from Malaysia (1.1%, a difference of 0.30%), Salvadoran (1.1%, a difference of 0.42%), and Immigrants from El Salvador (1.1%, a difference of 0.52%).
| Demographics | Rating | Rank | Disability Age Under 5 |
| Immigrants | Japan | 99.7 /100 | #50 | Exceptional 1.1% |
| Immigrants | Kazakhstan | 99.7 /100 | #51 | Exceptional 1.1% |
| Immigrants | Bolivia | 99.6 /100 | #52 | Exceptional 1.1% |
| Asians | 99.6 /100 | #53 | Exceptional 1.1% |
| Immigrants | El Salvador | 99.6 /100 | #54 | Exceptional 1.1% |
| Salvadorans | 99.5 /100 | #55 | Exceptional 1.1% |
| Ecuadorians | 99.5 /100 | #56 | Exceptional 1.1% |
| Assyrians/Chaldeans/Syriacs | 99.5 /100 | #57 | Exceptional 1.1% |
| Immigrants | Egypt | 99.4 /100 | #58 | Exceptional 1.1% |
| Immigrants | Malaysia | 99.4 /100 | #59 | Exceptional 1.1% |
| Immigrants | Western Asia | 99.2 /100 | #60 | Exceptional 1.1% |
| Immigrants | Ethiopia | 99.2 /100 | #61 | Exceptional 1.1% |
| Immigrants | Switzerland | 99.2 /100 | #62 | Exceptional 1.1% |
| Immigrants | Vietnam | 99.1 /100 | #63 | Exceptional 1.1% |
| Egyptians | 98.9 /100 | #64 | Exceptional 1.1% |