Ghanaian vs Assyrian/Chaldean/Syriac Disability Age Under 5
COMPARE
Ghanaian
Assyrian/Chaldean/Syriac
Disability Age Under 5
Disability Age Under 5 Comparison
Ghanaians
Assyrians/Chaldeans/Syriacs
1.2%
DISABILITY AGE UNDER 5
76.3/ 100
METRIC RATING
148th/ 347
METRIC RANK
1.1%
DISABILITY AGE UNDER 5
99.5/ 100
METRIC RATING
57th/ 347
METRIC RANK
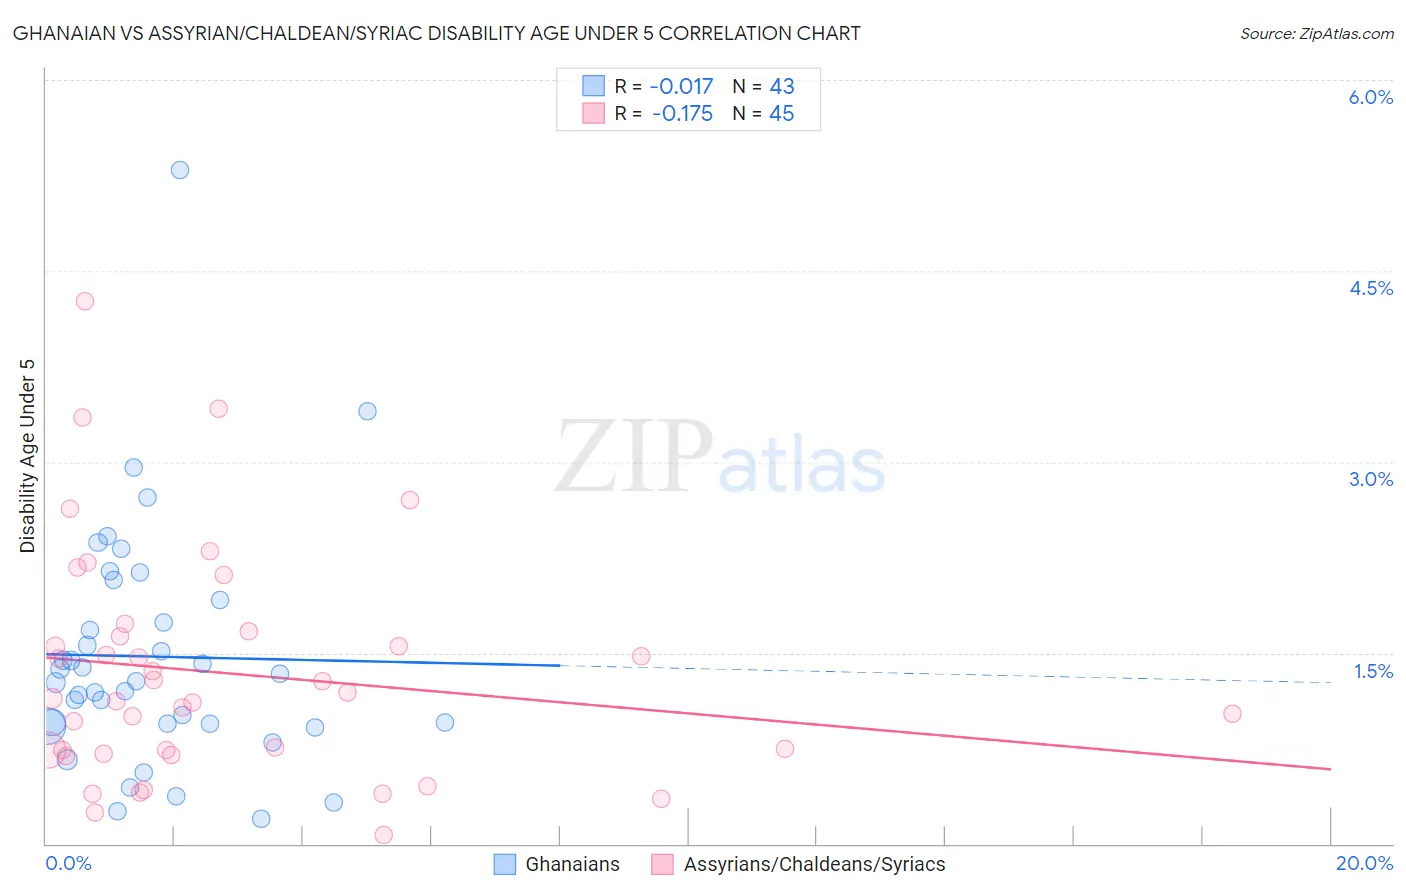
Ghanaian vs Assyrian/Chaldean/Syriac Disability Age Under 5 Correlation Chart
The statistical analysis conducted on geographies consisting of 127,583,107 people shows no correlation between the proportion of Ghanaians and percentage of population with a disability under the age of 5 in the United States with a correlation coefficient (R) of -0.017 and weighted average of 1.2%. Similarly, the statistical analysis conducted on geographies consisting of 81,585,974 people shows a poor negative correlation between the proportion of Assyrians/Chaldeans/Syriacs and percentage of population with a disability under the age of 5 in the United States with a correlation coefficient (R) of -0.175 and weighted average of 1.1%, a difference of 10.4%.
Disability Age Under 5 Correlation Summary
| Measurement | Ghanaian | Assyrian/Chaldean/Syriac |
| Minimum | 0.20% | 0.070% |
| Maximum | 5.3% | 4.3% |
| Range | 5.1% | 4.2% |
| Mean | 1.5% | 1.3% |
| Median | 1.3% | 1.1% |
| Interquartile 25% (IQ1) | 0.94% | 0.72% |
| Interquartile 75% (IQ3) | 1.9% | 1.6% |
| Interquartile Range (IQR) | 0.97% | 0.92% |
| Standard Deviation (Sample) | 0.94% | 0.90% |
| Standard Deviation (Population) | 0.93% | 0.89% |
Similar Demographics by Disability Age Under 5
Demographics Similar to Ghanaians by Disability Age Under 5
In terms of disability age under 5, the demographic groups most similar to Ghanaians are Icelander (1.2%, a difference of 0.010%), Kenyan (1.2%, a difference of 0.050%), South American (1.2%, a difference of 0.090%), Samoan (1.2%, a difference of 0.19%), and Yaqui (1.2%, a difference of 0.19%).
| Demographics | Rating | Rank | Disability Age Under 5 |
| Immigrants | Honduras | 80.4 /100 | #141 | Excellent 1.2% |
| Immigrants | Colombia | 79.3 /100 | #142 | Good 1.2% |
| Alsatians | 79.3 /100 | #143 | Good 1.2% |
| Immigrants | Middle Africa | 79.3 /100 | #144 | Good 1.2% |
| Immigrants | Zimbabwe | 77.9 /100 | #145 | Good 1.2% |
| Samoans | 77.7 /100 | #146 | Good 1.2% |
| Icelanders | 76.3 /100 | #147 | Good 1.2% |
| Ghanaians | 76.3 /100 | #148 | Good 1.2% |
| Kenyans | 75.9 /100 | #149 | Good 1.2% |
| South Americans | 75.6 /100 | #150 | Good 1.2% |
| Yaqui | 74.8 /100 | #151 | Good 1.2% |
| Hondurans | 72.5 /100 | #152 | Good 1.2% |
| Immigrants | Thailand | 69.4 /100 | #153 | Good 1.2% |
| Uruguayans | 68.8 /100 | #154 | Good 1.2% |
| Immigrants | Ghana | 68.7 /100 | #155 | Good 1.2% |
Demographics Similar to Assyrians/Chaldeans/Syriacs by Disability Age Under 5
In terms of disability age under 5, the demographic groups most similar to Assyrians/Chaldeans/Syriacs are Ecuadorian (1.1%, a difference of 0.030%), Immigrants from Egypt (1.1%, a difference of 0.19%), Immigrants from Malaysia (1.1%, a difference of 0.30%), Salvadoran (1.1%, a difference of 0.42%), and Immigrants from El Salvador (1.1%, a difference of 0.52%).
| Demographics | Rating | Rank | Disability Age Under 5 |
| Immigrants | Japan | 99.7 /100 | #50 | Exceptional 1.1% |
| Immigrants | Kazakhstan | 99.7 /100 | #51 | Exceptional 1.1% |
| Immigrants | Bolivia | 99.6 /100 | #52 | Exceptional 1.1% |
| Asians | 99.6 /100 | #53 | Exceptional 1.1% |
| Immigrants | El Salvador | 99.6 /100 | #54 | Exceptional 1.1% |
| Salvadorans | 99.5 /100 | #55 | Exceptional 1.1% |
| Ecuadorians | 99.5 /100 | #56 | Exceptional 1.1% |
| Assyrians/Chaldeans/Syriacs | 99.5 /100 | #57 | Exceptional 1.1% |
| Immigrants | Egypt | 99.4 /100 | #58 | Exceptional 1.1% |
| Immigrants | Malaysia | 99.4 /100 | #59 | Exceptional 1.1% |
| Immigrants | Western Asia | 99.2 /100 | #60 | Exceptional 1.1% |
| Immigrants | Ethiopia | 99.2 /100 | #61 | Exceptional 1.1% |
| Immigrants | Switzerland | 99.2 /100 | #62 | Exceptional 1.1% |
| Immigrants | Vietnam | 99.1 /100 | #63 | Exceptional 1.1% |
| Egyptians | 98.9 /100 | #64 | Exceptional 1.1% |