Danish vs Assyrian/Chaldean/Syriac Disability Age Under 5
COMPARE
Danish
Assyrian/Chaldean/Syriac
Disability Age Under 5
Disability Age Under 5 Comparison
Danes
Assyrians/Chaldeans/Syriacs
1.5%
DISABILITY AGE UNDER 5
0.0/ 100
METRIC RATING
279th/ 347
METRIC RANK
1.1%
DISABILITY AGE UNDER 5
99.5/ 100
METRIC RATING
57th/ 347
METRIC RANK
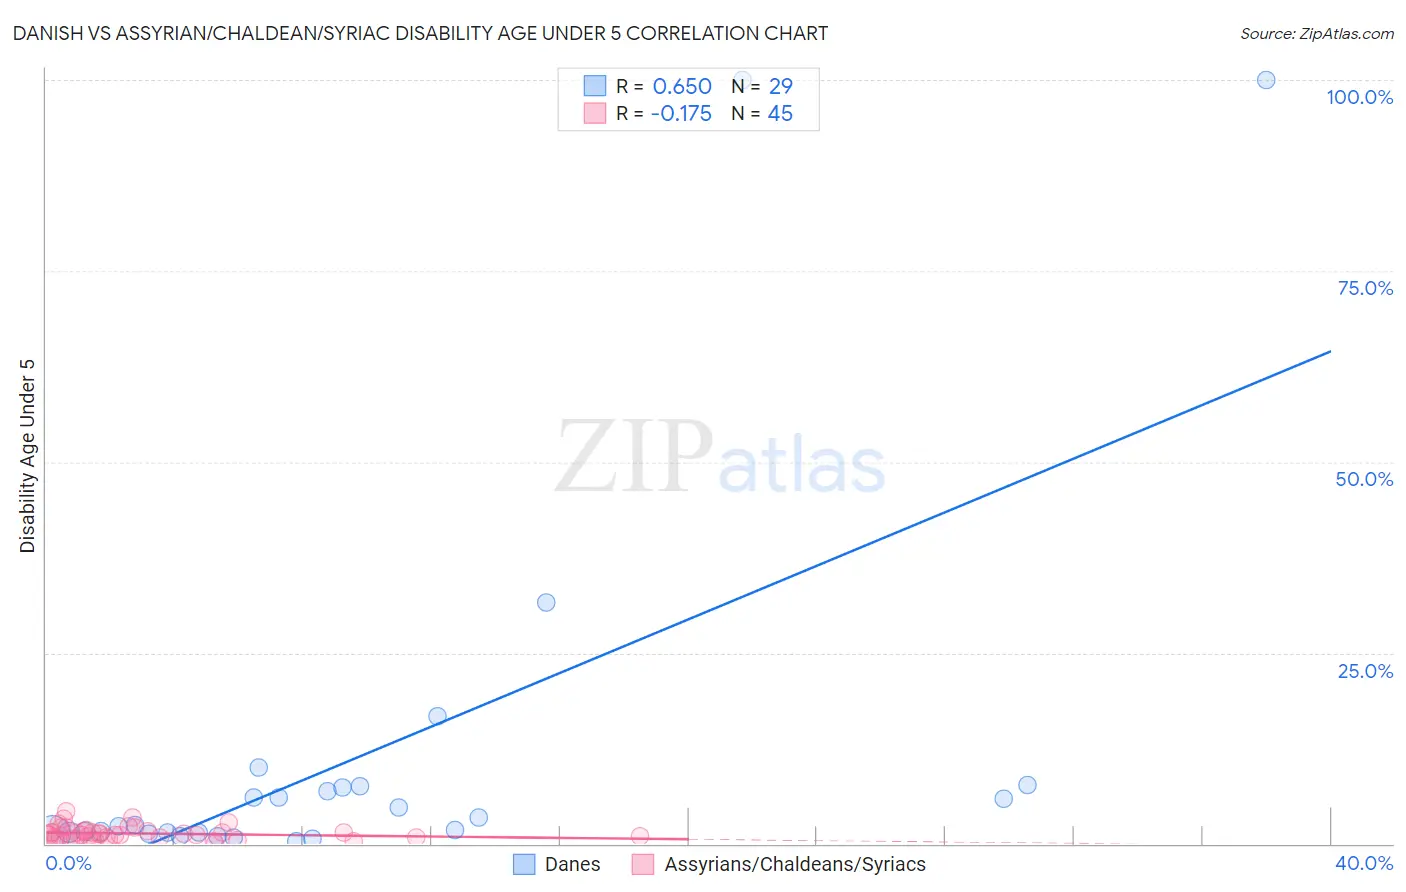
Danish vs Assyrian/Chaldean/Syriac Disability Age Under 5 Correlation Chart
The statistical analysis conducted on geographies consisting of 235,175,011 people shows a significant positive correlation between the proportion of Danes and percentage of population with a disability under the age of 5 in the United States with a correlation coefficient (R) of 0.650 and weighted average of 1.5%. Similarly, the statistical analysis conducted on geographies consisting of 81,585,974 people shows a poor negative correlation between the proportion of Assyrians/Chaldeans/Syriacs and percentage of population with a disability under the age of 5 in the United States with a correlation coefficient (R) of -0.175 and weighted average of 1.1%, a difference of 34.9%.
Disability Age Under 5 Correlation Summary
| Measurement | Danish | Assyrian/Chaldean/Syriac |
| Minimum | 0.30% | 0.070% |
| Maximum | 100.0% | 4.3% |
| Range | 99.7% | 4.2% |
| Mean | 11.5% | 1.3% |
| Median | 2.5% | 1.1% |
| Interquartile 25% (IQ1) | 1.4% | 0.72% |
| Interquartile 75% (IQ3) | 7.4% | 1.6% |
| Interquartile Range (IQR) | 6.0% | 0.92% |
| Standard Deviation (Sample) | 25.3% | 0.90% |
| Standard Deviation (Population) | 24.8% | 0.89% |
Similar Demographics by Disability Age Under 5
Demographics Similar to Danes by Disability Age Under 5
In terms of disability age under 5, the demographic groups most similar to Danes are Kiowa (1.5%, a difference of 0.010%), Canadian (1.5%, a difference of 0.090%), British (1.5%, a difference of 0.76%), Greek (1.5%, a difference of 0.79%), and Brazilian (1.5%, a difference of 1.4%).
| Demographics | Rating | Rank | Disability Age Under 5 |
| Blacks/African Americans | 0.1 /100 | #272 | Tragic 1.4% |
| Alaskan Athabascans | 0.1 /100 | #273 | Tragic 1.5% |
| Iroquois | 0.0 /100 | #274 | Tragic 1.5% |
| Brazilians | 0.0 /100 | #275 | Tragic 1.5% |
| Greeks | 0.0 /100 | #276 | Tragic 1.5% |
| Canadians | 0.0 /100 | #277 | Tragic 1.5% |
| Kiowa | 0.0 /100 | #278 | Tragic 1.5% |
| Danes | 0.0 /100 | #279 | Tragic 1.5% |
| British | 0.0 /100 | #280 | Tragic 1.5% |
| Czechoslovakians | 0.0 /100 | #281 | Tragic 1.5% |
| Cheyenne | 0.0 /100 | #282 | Tragic 1.5% |
| Delaware | 0.0 /100 | #283 | Tragic 1.5% |
| Europeans | 0.0 /100 | #284 | Tragic 1.5% |
| Croatians | 0.0 /100 | #285 | Tragic 1.5% |
| Tlingit-Haida | 0.0 /100 | #286 | Tragic 1.5% |
Demographics Similar to Assyrians/Chaldeans/Syriacs by Disability Age Under 5
In terms of disability age under 5, the demographic groups most similar to Assyrians/Chaldeans/Syriacs are Ecuadorian (1.1%, a difference of 0.030%), Immigrants from Egypt (1.1%, a difference of 0.19%), Immigrants from Malaysia (1.1%, a difference of 0.30%), Salvadoran (1.1%, a difference of 0.42%), and Immigrants from El Salvador (1.1%, a difference of 0.52%).
| Demographics | Rating | Rank | Disability Age Under 5 |
| Immigrants | Japan | 99.7 /100 | #50 | Exceptional 1.1% |
| Immigrants | Kazakhstan | 99.7 /100 | #51 | Exceptional 1.1% |
| Immigrants | Bolivia | 99.6 /100 | #52 | Exceptional 1.1% |
| Asians | 99.6 /100 | #53 | Exceptional 1.1% |
| Immigrants | El Salvador | 99.6 /100 | #54 | Exceptional 1.1% |
| Salvadorans | 99.5 /100 | #55 | Exceptional 1.1% |
| Ecuadorians | 99.5 /100 | #56 | Exceptional 1.1% |
| Assyrians/Chaldeans/Syriacs | 99.5 /100 | #57 | Exceptional 1.1% |
| Immigrants | Egypt | 99.4 /100 | #58 | Exceptional 1.1% |
| Immigrants | Malaysia | 99.4 /100 | #59 | Exceptional 1.1% |
| Immigrants | Western Asia | 99.2 /100 | #60 | Exceptional 1.1% |
| Immigrants | Ethiopia | 99.2 /100 | #61 | Exceptional 1.1% |
| Immigrants | Switzerland | 99.2 /100 | #62 | Exceptional 1.1% |
| Immigrants | Vietnam | 99.1 /100 | #63 | Exceptional 1.1% |
| Egyptians | 98.9 /100 | #64 | Exceptional 1.1% |