English vs Austrian Disability Age Under 5
COMPARE
English
Austrian
Disability Age Under 5
Disability Age Under 5 Comparison
English
Austrians
1.7%
DISABILITY AGE UNDER 5
0.0/ 100
METRIC RATING
311th/ 347
METRIC RANK
1.4%
DISABILITY AGE UNDER 5
0.1/ 100
METRIC RATING
269th/ 347
METRIC RANK
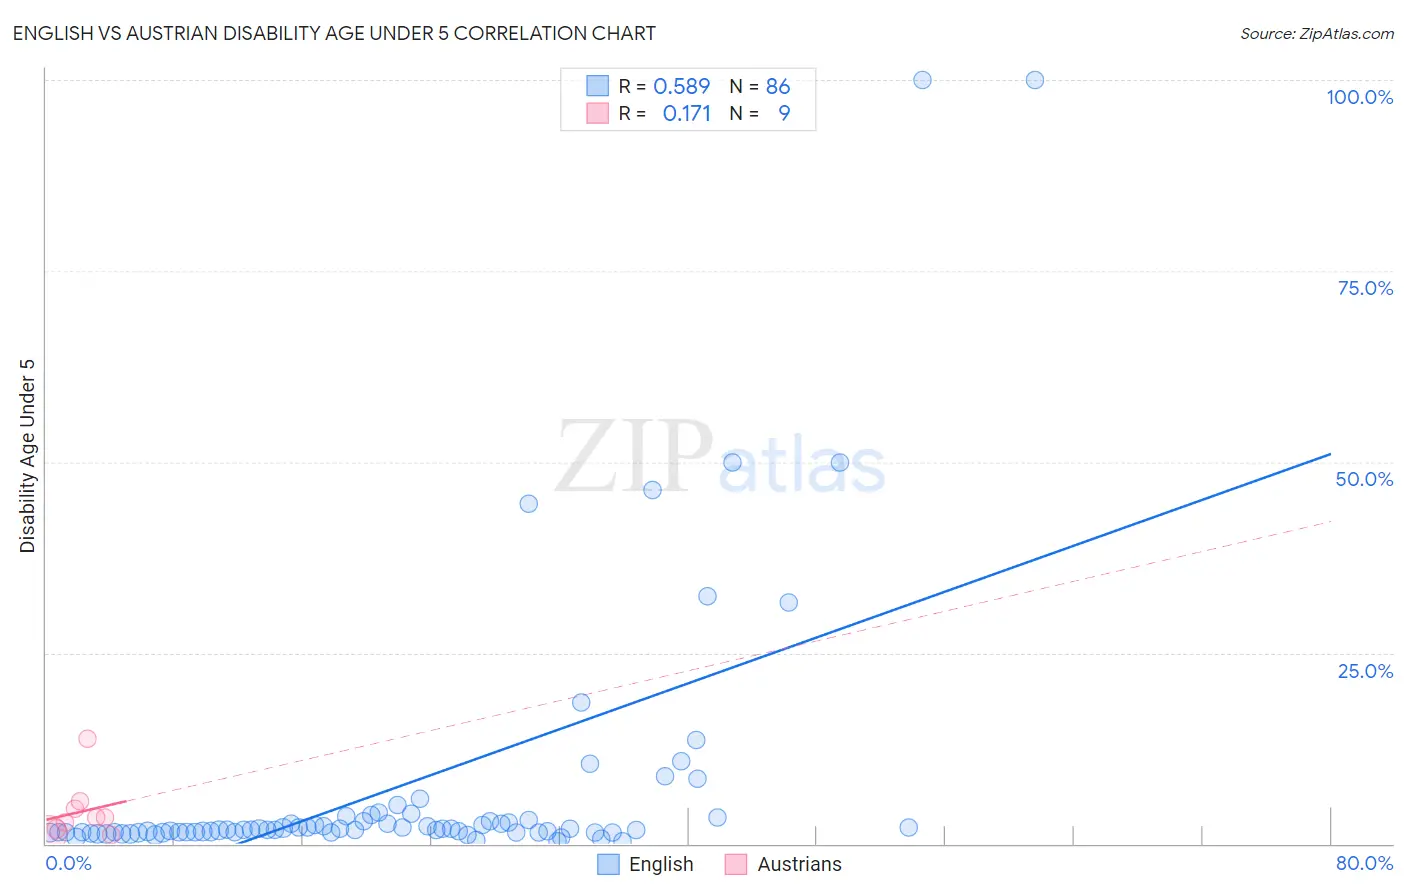
English vs Austrian Disability Age Under 5 Correlation Chart
The statistical analysis conducted on geographies consisting of 261,226,703 people shows a substantial positive correlation between the proportion of English and percentage of population with a disability under the age of 5 in the United States with a correlation coefficient (R) of 0.589 and weighted average of 1.7%. Similarly, the statistical analysis conducted on geographies consisting of 227,811,367 people shows a poor positive correlation between the proportion of Austrians and percentage of population with a disability under the age of 5 in the United States with a correlation coefficient (R) of 0.171 and weighted average of 1.4%, a difference of 15.9%.
Disability Age Under 5 Correlation Summary
| Measurement | English | Austrian |
| Minimum | 0.36% | 1.2% |
| Maximum | 100.0% | 13.7% |
| Range | 99.6% | 12.5% |
| Mean | 7.8% | 4.2% |
| Median | 1.9% | 3.4% |
| Interquartile 25% (IQ1) | 1.5% | 1.6% |
| Interquartile 75% (IQ3) | 3.2% | 5.0% |
| Interquartile Range (IQR) | 1.7% | 3.4% |
| Standard Deviation (Sample) | 17.9% | 3.8% |
| Standard Deviation (Population) | 17.8% | 3.6% |
Similar Demographics by Disability Age Under 5
Demographics Similar to English by Disability Age Under 5
In terms of disability age under 5, the demographic groups most similar to English are Puerto Rican (1.7%, a difference of 0.040%), Celtic (1.7%, a difference of 0.20%), Norwegian (1.7%, a difference of 0.36%), White/Caucasian (1.7%, a difference of 0.59%), and Dutch (1.7%, a difference of 0.62%).
| Demographics | Rating | Rank | Disability Age Under 5 |
| Seminole | 0.0 /100 | #304 | Tragic 1.6% |
| Blackfeet | 0.0 /100 | #305 | Tragic 1.6% |
| Creek | 0.0 /100 | #306 | Tragic 1.6% |
| Scottish | 0.0 /100 | #307 | Tragic 1.6% |
| Navajo | 0.0 /100 | #308 | Tragic 1.6% |
| Cape Verdeans | 0.0 /100 | #309 | Tragic 1.7% |
| Whites/Caucasians | 0.0 /100 | #310 | Tragic 1.7% |
| English | 0.0 /100 | #311 | Tragic 1.7% |
| Puerto Ricans | 0.0 /100 | #312 | Tragic 1.7% |
| Celtics | 0.0 /100 | #313 | Tragic 1.7% |
| Norwegians | 0.0 /100 | #314 | Tragic 1.7% |
| Dutch | 0.0 /100 | #315 | Tragic 1.7% |
| Immigrants | Cabo Verde | 0.0 /100 | #316 | Tragic 1.7% |
| French | 0.0 /100 | #317 | Tragic 1.7% |
| Irish | 0.0 /100 | #318 | Tragic 1.7% |
Demographics Similar to Austrians by Disability Age Under 5
In terms of disability age under 5, the demographic groups most similar to Austrians are Immigrants from North America (1.4%, a difference of 0.13%), Immigrants from Canada (1.4%, a difference of 0.17%), Belgian (1.4%, a difference of 0.18%), Black/African American (1.4%, a difference of 0.33%), and Alaskan Athabascan (1.5%, a difference of 0.63%).
| Demographics | Rating | Rank | Disability Age Under 5 |
| Immigrants | Dominica | 0.2 /100 | #262 | Tragic 1.4% |
| Spanish | 0.2 /100 | #263 | Tragic 1.4% |
| Yugoslavians | 0.1 /100 | #264 | Tragic 1.4% |
| Carpatho Rusyns | 0.1 /100 | #265 | Tragic 1.4% |
| Immigrants | Germany | 0.1 /100 | #266 | Tragic 1.4% |
| Cree | 0.1 /100 | #267 | Tragic 1.4% |
| Belgians | 0.1 /100 | #268 | Tragic 1.4% |
| Austrians | 0.1 /100 | #269 | Tragic 1.4% |
| Immigrants | North America | 0.1 /100 | #270 | Tragic 1.4% |
| Immigrants | Canada | 0.1 /100 | #271 | Tragic 1.4% |
| Blacks/African Americans | 0.1 /100 | #272 | Tragic 1.4% |
| Alaskan Athabascans | 0.1 /100 | #273 | Tragic 1.5% |
| Iroquois | 0.0 /100 | #274 | Tragic 1.5% |
| Brazilians | 0.0 /100 | #275 | Tragic 1.5% |
| Greeks | 0.0 /100 | #276 | Tragic 1.5% |