English vs Immigrants from Bulgaria Disability Age Under 5
COMPARE
English
Immigrants from Bulgaria
Disability Age Under 5
Disability Age Under 5 Comparison
English
Immigrants from Bulgaria
1.7%
DISABILITY AGE UNDER 5
0.0/ 100
METRIC RATING
311th/ 347
METRIC RANK
1.1%
DISABILITY AGE UNDER 5
99.8/ 100
METRIC RATING
42nd/ 347
METRIC RANK
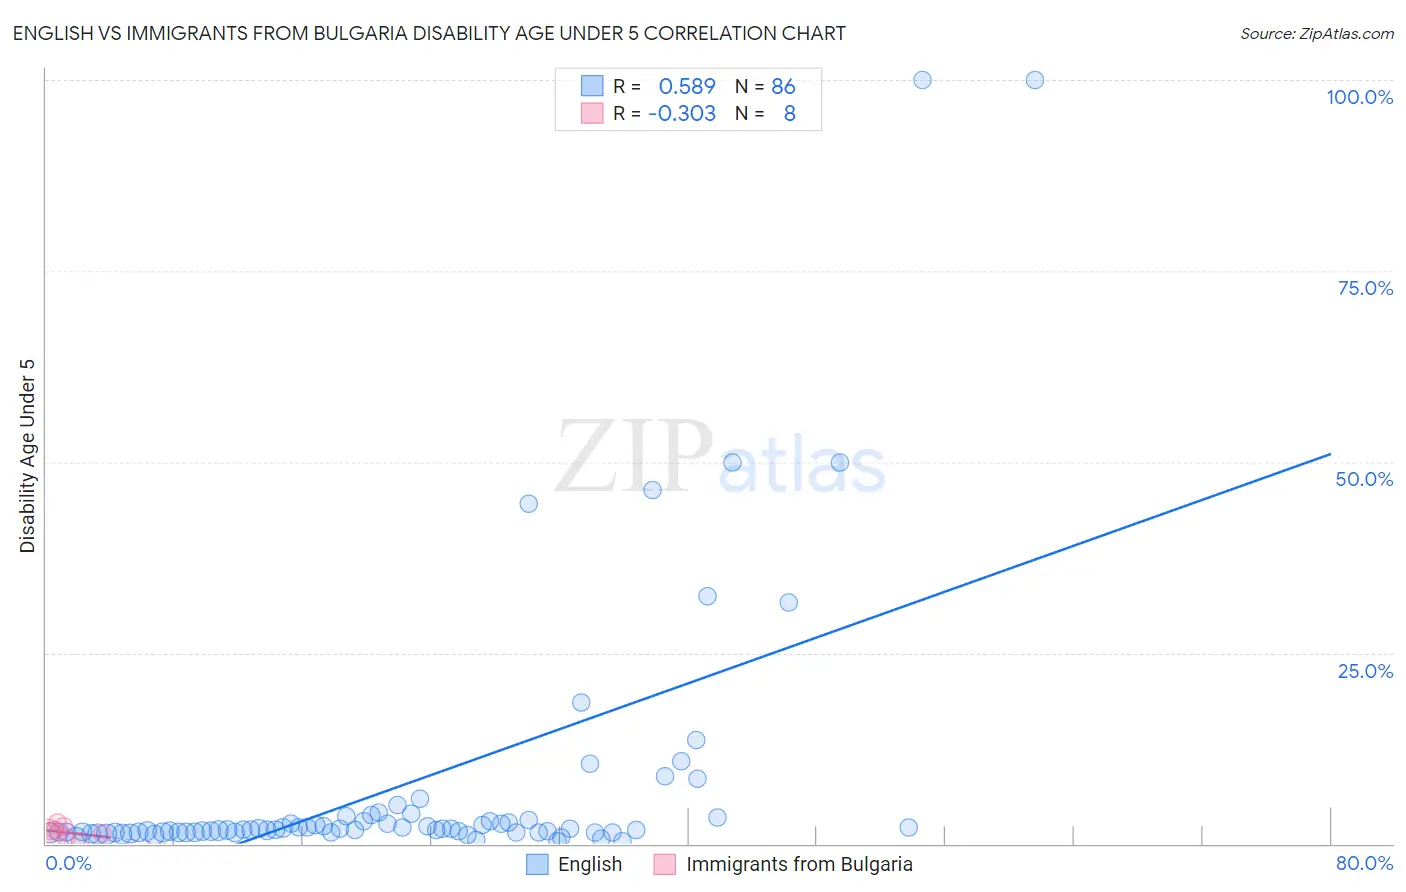
English vs Immigrants from Bulgaria Disability Age Under 5 Correlation Chart
The statistical analysis conducted on geographies consisting of 261,226,703 people shows a substantial positive correlation between the proportion of English and percentage of population with a disability under the age of 5 in the United States with a correlation coefficient (R) of 0.589 and weighted average of 1.7%. Similarly, the statistical analysis conducted on geographies consisting of 114,268,048 people shows a mild negative correlation between the proportion of Immigrants from Bulgaria and percentage of population with a disability under the age of 5 in the United States with a correlation coefficient (R) of -0.303 and weighted average of 1.1%, a difference of 57.4%.
Disability Age Under 5 Correlation Summary
| Measurement | English | Immigrants from Bulgaria |
| Minimum | 0.36% | 0.31% |
| Maximum | 100.0% | 2.9% |
| Range | 99.6% | 2.6% |
| Mean | 7.8% | 1.5% |
| Median | 1.9% | 1.5% |
| Interquartile 25% (IQ1) | 1.5% | 0.81% |
| Interquartile 75% (IQ3) | 3.2% | 2.0% |
| Interquartile Range (IQR) | 1.7% | 1.2% |
| Standard Deviation (Sample) | 17.9% | 0.84% |
| Standard Deviation (Population) | 17.8% | 0.79% |
Similar Demographics by Disability Age Under 5
Demographics Similar to English by Disability Age Under 5
In terms of disability age under 5, the demographic groups most similar to English are Puerto Rican (1.7%, a difference of 0.040%), Celtic (1.7%, a difference of 0.20%), Norwegian (1.7%, a difference of 0.36%), White/Caucasian (1.7%, a difference of 0.59%), and Dutch (1.7%, a difference of 0.62%).
| Demographics | Rating | Rank | Disability Age Under 5 |
| Seminole | 0.0 /100 | #304 | Tragic 1.6% |
| Blackfeet | 0.0 /100 | #305 | Tragic 1.6% |
| Creek | 0.0 /100 | #306 | Tragic 1.6% |
| Scottish | 0.0 /100 | #307 | Tragic 1.6% |
| Navajo | 0.0 /100 | #308 | Tragic 1.6% |
| Cape Verdeans | 0.0 /100 | #309 | Tragic 1.7% |
| Whites/Caucasians | 0.0 /100 | #310 | Tragic 1.7% |
| English | 0.0 /100 | #311 | Tragic 1.7% |
| Puerto Ricans | 0.0 /100 | #312 | Tragic 1.7% |
| Celtics | 0.0 /100 | #313 | Tragic 1.7% |
| Norwegians | 0.0 /100 | #314 | Tragic 1.7% |
| Dutch | 0.0 /100 | #315 | Tragic 1.7% |
| Immigrants | Cabo Verde | 0.0 /100 | #316 | Tragic 1.7% |
| French | 0.0 /100 | #317 | Tragic 1.7% |
| Irish | 0.0 /100 | #318 | Tragic 1.7% |
Demographics Similar to Immigrants from Bulgaria by Disability Age Under 5
In terms of disability age under 5, the demographic groups most similar to Immigrants from Bulgaria are Pima (1.1%, a difference of 0.010%), Thai (1.1%, a difference of 0.10%), Immigrants from Asia (1.1%, a difference of 0.11%), Immigrants from Turkey (1.1%, a difference of 0.33%), and Immigrants from Albania (1.1%, a difference of 0.51%).
| Demographics | Rating | Rank | Disability Age Under 5 |
| Barbadians | 99.9 /100 | #35 | Exceptional 1.0% |
| Immigrants | Nepal | 99.9 /100 | #36 | Exceptional 1.0% |
| Immigrants | India | 99.9 /100 | #37 | Exceptional 1.0% |
| Immigrants | Guyana | 99.9 /100 | #38 | Exceptional 1.0% |
| Filipinos | 99.9 /100 | #39 | Exceptional 1.1% |
| Immigrants | Albania | 99.9 /100 | #40 | Exceptional 1.1% |
| Thais | 99.8 /100 | #41 | Exceptional 1.1% |
| Immigrants | Bulgaria | 99.8 /100 | #42 | Exceptional 1.1% |
| Pima | 99.8 /100 | #43 | Exceptional 1.1% |
| Immigrants | Asia | 99.8 /100 | #44 | Exceptional 1.1% |
| Immigrants | Turkey | 99.8 /100 | #45 | Exceptional 1.1% |
| Immigrants | Congo | 99.8 /100 | #46 | Exceptional 1.1% |
| Immigrants | Sweden | 99.8 /100 | #47 | Exceptional 1.1% |
| Immigrants | Singapore | 99.7 /100 | #48 | Exceptional 1.1% |
| Immigrants | Russia | 99.7 /100 | #49 | Exceptional 1.1% |