Belizean vs Assyrian/Chaldean/Syriac Disability Age Under 5
COMPARE
Belizean
Assyrian/Chaldean/Syriac
Disability Age Under 5
Disability Age Under 5 Comparison
Belizeans
Assyrians/Chaldeans/Syriacs
1.2%
DISABILITY AGE UNDER 5
93.9/ 100
METRIC RATING
114th/ 347
METRIC RANK
1.1%
DISABILITY AGE UNDER 5
99.5/ 100
METRIC RATING
57th/ 347
METRIC RANK
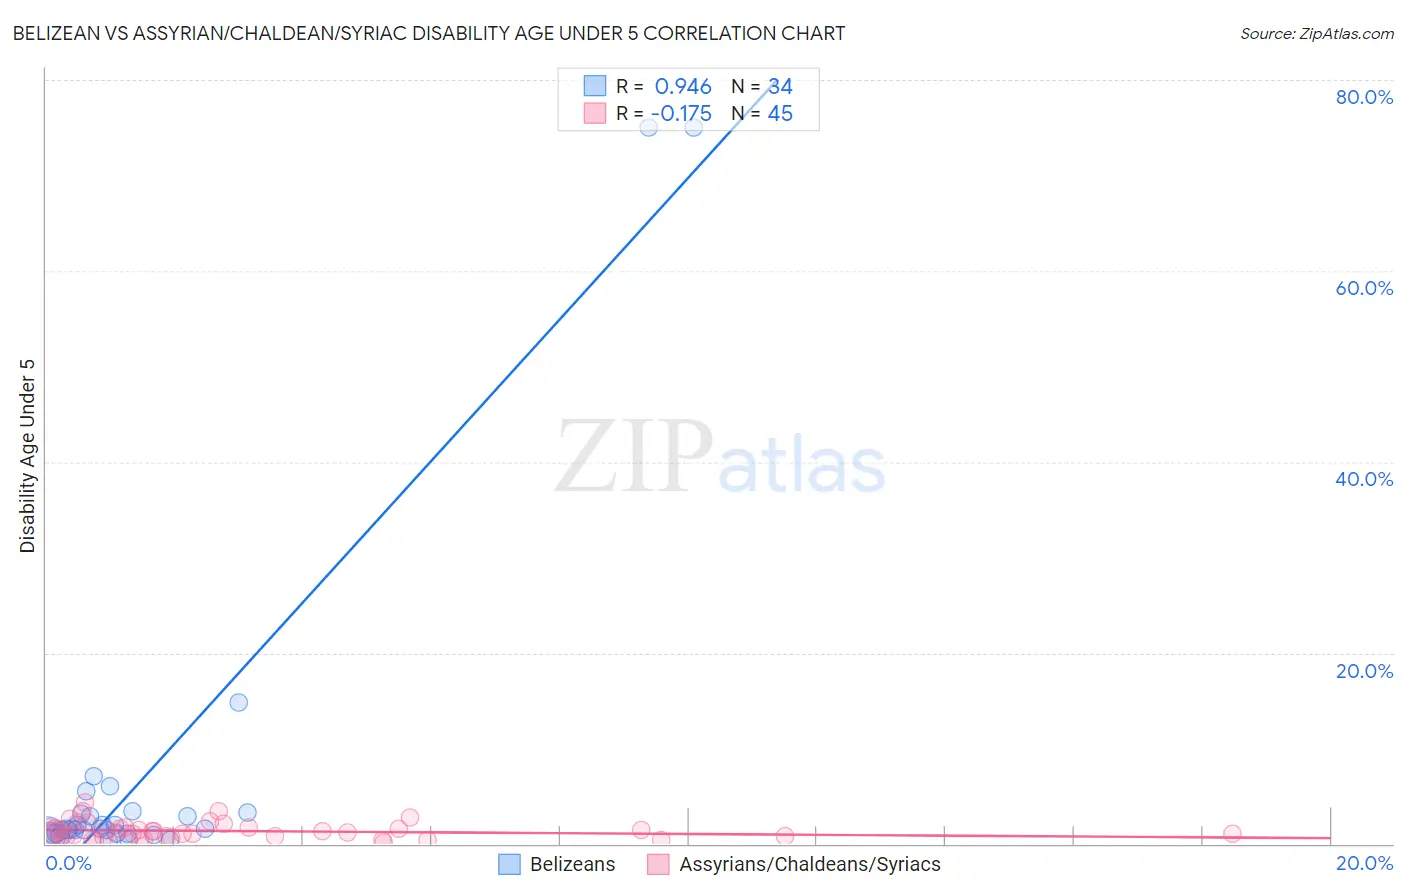
Belizean vs Assyrian/Chaldean/Syriac Disability Age Under 5 Correlation Chart
The statistical analysis conducted on geographies consisting of 106,629,681 people shows a near-perfect positive correlation between the proportion of Belizeans and percentage of population with a disability under the age of 5 in the United States with a correlation coefficient (R) of 0.946 and weighted average of 1.2%. Similarly, the statistical analysis conducted on geographies consisting of 81,585,974 people shows a poor negative correlation between the proportion of Assyrians/Chaldeans/Syriacs and percentage of population with a disability under the age of 5 in the United States with a correlation coefficient (R) of -0.175 and weighted average of 1.1%, a difference of 6.4%.
Disability Age Under 5 Correlation Summary
| Measurement | Belizean | Assyrian/Chaldean/Syriac |
| Minimum | 0.27% | 0.070% |
| Maximum | 75.0% | 4.3% |
| Range | 74.7% | 4.2% |
| Mean | 6.7% | 1.3% |
| Median | 1.5% | 1.1% |
| Interquartile 25% (IQ1) | 1.0% | 0.72% |
| Interquartile 75% (IQ3) | 3.1% | 1.6% |
| Interquartile Range (IQR) | 2.1% | 0.92% |
| Standard Deviation (Sample) | 17.5% | 0.90% |
| Standard Deviation (Population) | 17.3% | 0.89% |
Similar Demographics by Disability Age Under 5
Demographics Similar to Belizeans by Disability Age Under 5
In terms of disability age under 5, the demographic groups most similar to Belizeans are Immigrants from Caribbean (1.2%, a difference of 0.010%), Immigrants from Northern Africa (1.2%, a difference of 0.030%), Immigrants from Oceania (1.2%, a difference of 0.15%), Immigrants from Philippines (1.2%, a difference of 0.17%), and Immigrants from Venezuela (1.2%, a difference of 0.20%).
| Demographics | Rating | Rank | Disability Age Under 5 |
| Immigrants | West Indies | 95.3 /100 | #107 | Exceptional 1.2% |
| Iraqis | 95.1 /100 | #108 | Exceptional 1.2% |
| Immigrants | Panama | 95.0 /100 | #109 | Exceptional 1.2% |
| Immigrants | Lebanon | 95.0 /100 | #110 | Exceptional 1.2% |
| Senegalese | 94.6 /100 | #111 | Exceptional 1.2% |
| Immigrants | Australia | 94.4 /100 | #112 | Exceptional 1.2% |
| Immigrants | Oceania | 94.2 /100 | #113 | Exceptional 1.2% |
| Belizeans | 93.9 /100 | #114 | Exceptional 1.2% |
| Immigrants | Caribbean | 93.8 /100 | #115 | Exceptional 1.2% |
| Immigrants | Northern Africa | 93.8 /100 | #116 | Exceptional 1.2% |
| Immigrants | Philippines | 93.5 /100 | #117 | Exceptional 1.2% |
| Immigrants | Venezuela | 93.4 /100 | #118 | Exceptional 1.2% |
| Bhutanese | 92.5 /100 | #119 | Exceptional 1.2% |
| Immigrants | Eritrea | 92.3 /100 | #120 | Exceptional 1.2% |
| Immigrants | Senegal | 91.4 /100 | #121 | Exceptional 1.2% |
Demographics Similar to Assyrians/Chaldeans/Syriacs by Disability Age Under 5
In terms of disability age under 5, the demographic groups most similar to Assyrians/Chaldeans/Syriacs are Ecuadorian (1.1%, a difference of 0.030%), Immigrants from Egypt (1.1%, a difference of 0.19%), Immigrants from Malaysia (1.1%, a difference of 0.30%), Salvadoran (1.1%, a difference of 0.42%), and Immigrants from El Salvador (1.1%, a difference of 0.52%).
| Demographics | Rating | Rank | Disability Age Under 5 |
| Immigrants | Japan | 99.7 /100 | #50 | Exceptional 1.1% |
| Immigrants | Kazakhstan | 99.7 /100 | #51 | Exceptional 1.1% |
| Immigrants | Bolivia | 99.6 /100 | #52 | Exceptional 1.1% |
| Asians | 99.6 /100 | #53 | Exceptional 1.1% |
| Immigrants | El Salvador | 99.6 /100 | #54 | Exceptional 1.1% |
| Salvadorans | 99.5 /100 | #55 | Exceptional 1.1% |
| Ecuadorians | 99.5 /100 | #56 | Exceptional 1.1% |
| Assyrians/Chaldeans/Syriacs | 99.5 /100 | #57 | Exceptional 1.1% |
| Immigrants | Egypt | 99.4 /100 | #58 | Exceptional 1.1% |
| Immigrants | Malaysia | 99.4 /100 | #59 | Exceptional 1.1% |
| Immigrants | Western Asia | 99.2 /100 | #60 | Exceptional 1.1% |
| Immigrants | Ethiopia | 99.2 /100 | #61 | Exceptional 1.1% |
| Immigrants | Switzerland | 99.2 /100 | #62 | Exceptional 1.1% |
| Immigrants | Vietnam | 99.1 /100 | #63 | Exceptional 1.1% |
| Egyptians | 98.9 /100 | #64 | Exceptional 1.1% |