Apache vs Sioux Hearing Disability
COMPARE
Apache
Sioux
Hearing Disability
Hearing Disability Comparison
Apache
Sioux
4.1%
HEARING DISABILITY
0.0/ 100
METRIC RATING
323rd/ 347
METRIC RANK
3.6%
HEARING DISABILITY
0.0/ 100
METRIC RATING
285th/ 347
METRIC RANK
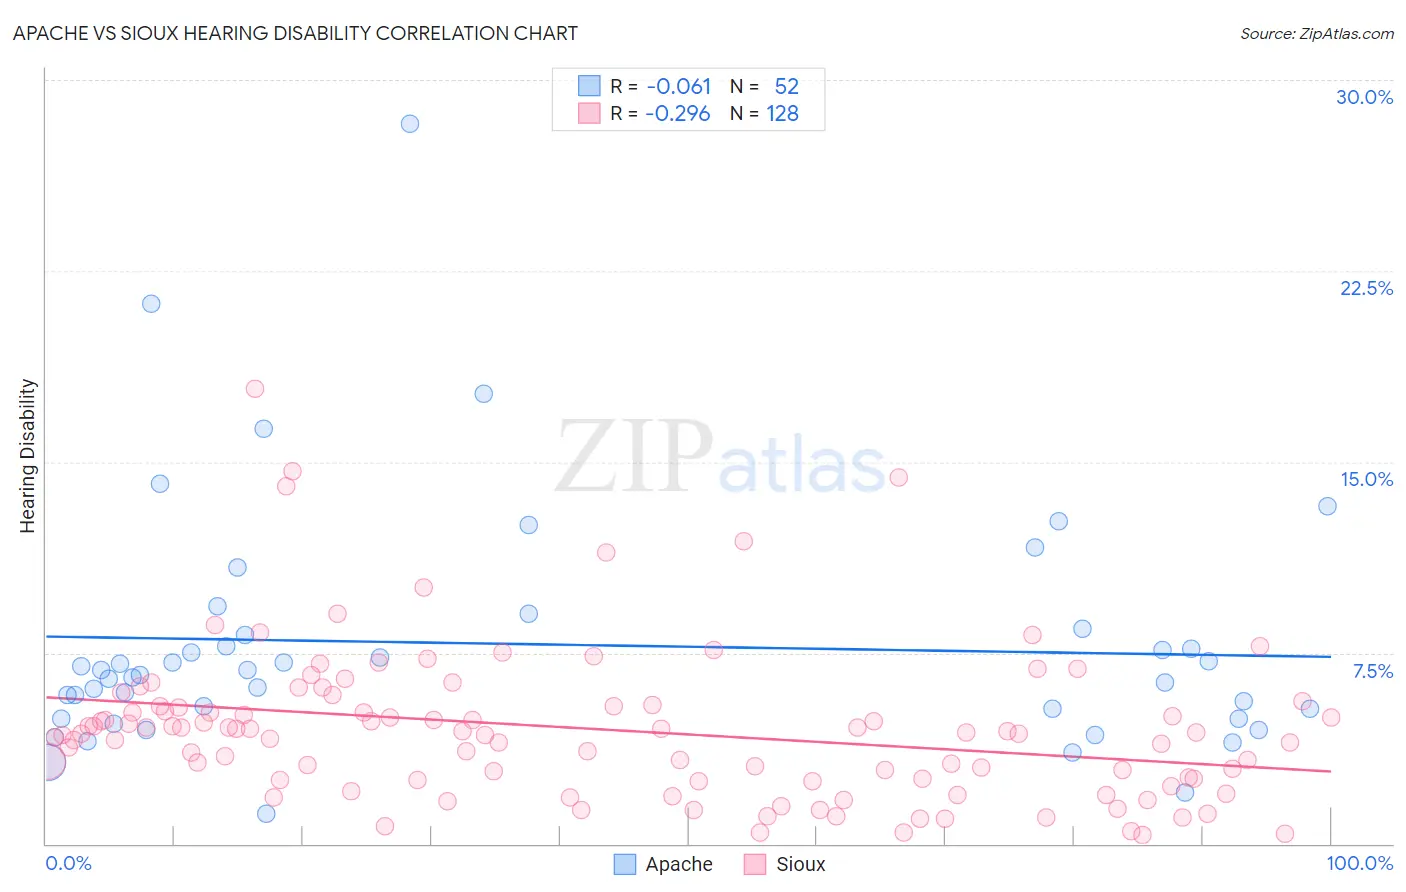
Apache vs Sioux Hearing Disability Correlation Chart
The statistical analysis conducted on geographies consisting of 231,022,751 people shows a slight negative correlation between the proportion of Apache and percentage of population with hearing disability in the United States with a correlation coefficient (R) of -0.061 and weighted average of 4.1%. Similarly, the statistical analysis conducted on geographies consisting of 234,128,884 people shows a weak negative correlation between the proportion of Sioux and percentage of population with hearing disability in the United States with a correlation coefficient (R) of -0.296 and weighted average of 3.6%, a difference of 12.4%.
Hearing Disability Correlation Summary
| Measurement | Apache | Sioux |
| Minimum | 1.2% | 0.37% |
| Maximum | 28.3% | 17.9% |
| Range | 27.1% | 17.5% |
| Mean | 7.8% | 4.5% |
| Median | 6.7% | 4.3% |
| Interquartile 25% (IQ1) | 5.1% | 2.5% |
| Interquartile 75% (IQ3) | 8.3% | 5.4% |
| Interquartile Range (IQR) | 3.2% | 2.9% |
| Standard Deviation (Sample) | 4.8% | 3.0% |
| Standard Deviation (Population) | 4.8% | 3.0% |
Similar Demographics by Hearing Disability
Demographics Similar to Apache by Hearing Disability
In terms of hearing disability, the demographic groups most similar to Apache are Osage (4.1%, a difference of 0.070%), Seminole (4.1%, a difference of 0.12%), Paiute (4.1%, a difference of 0.38%), Lumbee (4.1%, a difference of 0.39%), and Potawatomi (4.1%, a difference of 0.68%).
| Demographics | Rating | Rank | Hearing Disability |
| Spanish Americans | 0.0 /100 | #316 | Tragic 4.0% |
| Comanche | 0.0 /100 | #317 | Tragic 4.0% |
| Cheyenne | 0.0 /100 | #318 | Tragic 4.0% |
| Chippewa | 0.0 /100 | #319 | Tragic 4.0% |
| Shoshone | 0.0 /100 | #320 | Tragic 4.0% |
| Paiute | 0.0 /100 | #321 | Tragic 4.1% |
| Seminole | 0.0 /100 | #322 | Tragic 4.1% |
| Apache | 0.0 /100 | #323 | Tragic 4.1% |
| Osage | 0.0 /100 | #324 | Tragic 4.1% |
| Lumbee | 0.0 /100 | #325 | Tragic 4.1% |
| Potawatomi | 0.0 /100 | #326 | Tragic 4.1% |
| Arapaho | 0.0 /100 | #327 | Tragic 4.1% |
| Tohono O'odham | 0.0 /100 | #328 | Tragic 4.2% |
| Crow | 0.0 /100 | #329 | Tragic 4.2% |
| Natives/Alaskans | 0.0 /100 | #330 | Tragic 4.2% |
Demographics Similar to Sioux by Hearing Disability
In terms of hearing disability, the demographic groups most similar to Sioux are Delaware (3.6%, a difference of 0.030%), Immigrants from Micronesia (3.6%, a difference of 0.10%), Spanish (3.7%, a difference of 0.28%), Blackfeet (3.6%, a difference of 0.57%), and Swedish (3.6%, a difference of 0.82%).
| Demographics | Rating | Rank | Hearing Disability |
| Basques | 0.0 /100 | #278 | Tragic 3.6% |
| Slovaks | 0.0 /100 | #279 | Tragic 3.6% |
| French American Indians | 0.0 /100 | #280 | Tragic 3.6% |
| Scandinavians | 0.0 /100 | #281 | Tragic 3.6% |
| Swedes | 0.0 /100 | #282 | Tragic 3.6% |
| Blackfeet | 0.0 /100 | #283 | Tragic 3.6% |
| Immigrants | Micronesia | 0.0 /100 | #284 | Tragic 3.6% |
| Sioux | 0.0 /100 | #285 | Tragic 3.6% |
| Delaware | 0.0 /100 | #286 | Tragic 3.6% |
| Spanish | 0.0 /100 | #287 | Tragic 3.7% |
| Irish | 0.0 /100 | #288 | Tragic 3.7% |
| Chinese | 0.0 /100 | #289 | Tragic 3.7% |
| Whites/Caucasians | 0.0 /100 | #290 | Tragic 3.7% |
| Finns | 0.0 /100 | #291 | Tragic 3.7% |
| Native Hawaiians | 0.0 /100 | #292 | Tragic 3.7% |