Guatemalan vs Sioux Hearing Disability
COMPARE
Guatemalan
Sioux
Hearing Disability
Hearing Disability Comparison
Guatemalans
Sioux
2.8%
HEARING DISABILITY
93.2/ 100
METRIC RATING
108th/ 347
METRIC RANK
3.6%
HEARING DISABILITY
0.0/ 100
METRIC RATING
285th/ 347
METRIC RANK
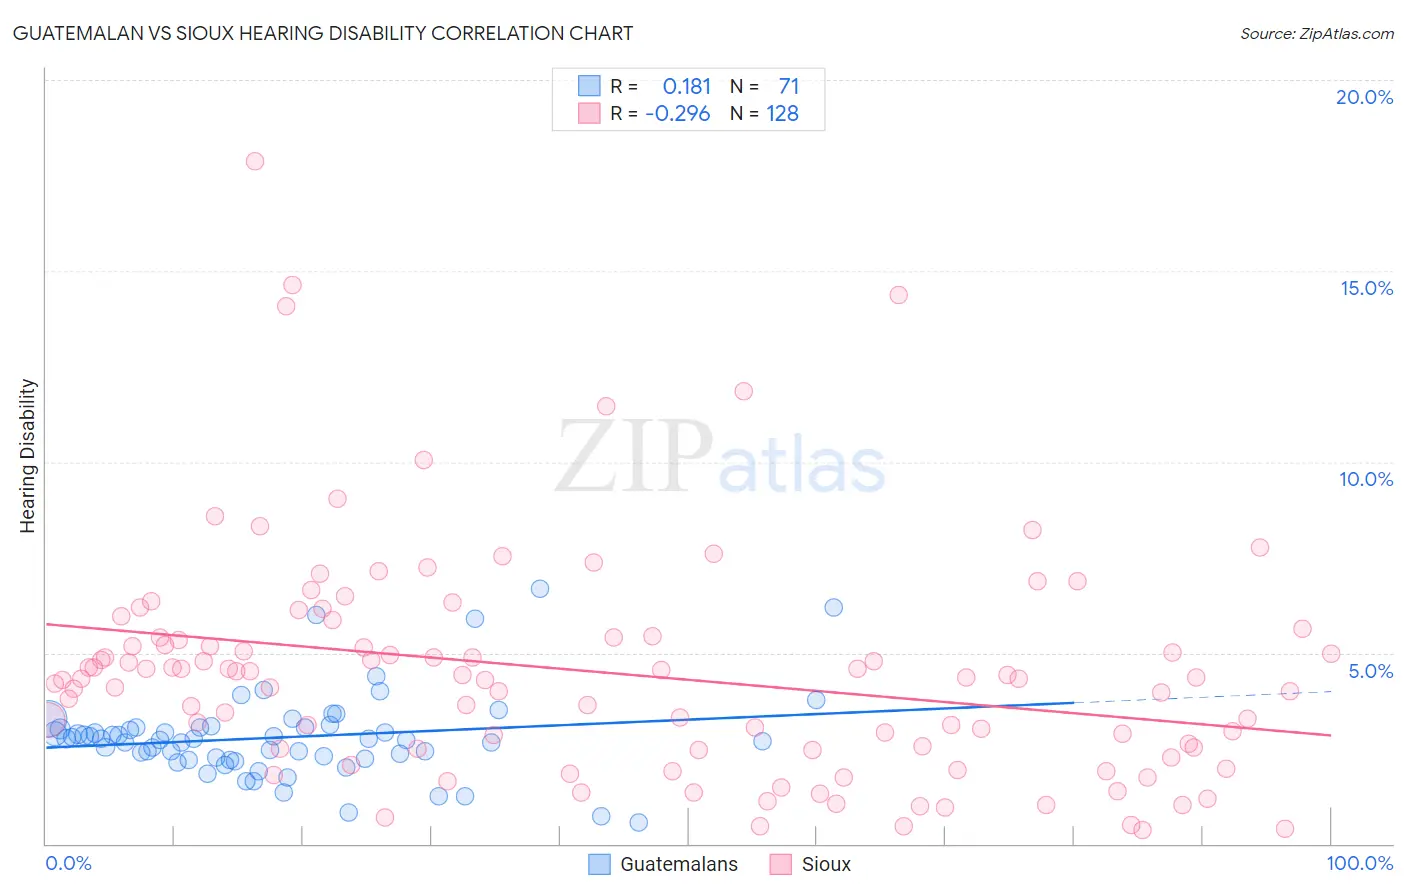
Guatemalan vs Sioux Hearing Disability Correlation Chart
The statistical analysis conducted on geographies consisting of 409,374,057 people shows a poor positive correlation between the proportion of Guatemalans and percentage of population with hearing disability in the United States with a correlation coefficient (R) of 0.181 and weighted average of 2.8%. Similarly, the statistical analysis conducted on geographies consisting of 234,128,884 people shows a weak negative correlation between the proportion of Sioux and percentage of population with hearing disability in the United States with a correlation coefficient (R) of -0.296 and weighted average of 3.6%, a difference of 29.5%.
Hearing Disability Correlation Summary
| Measurement | Guatemalan | Sioux |
| Minimum | 0.55% | 0.37% |
| Maximum | 6.7% | 17.9% |
| Range | 6.1% | 17.5% |
| Mean | 2.8% | 4.5% |
| Median | 2.7% | 4.3% |
| Interquartile 25% (IQ1) | 2.2% | 2.5% |
| Interquartile 75% (IQ3) | 3.0% | 5.4% |
| Interquartile Range (IQR) | 0.81% | 2.9% |
| Standard Deviation (Sample) | 1.1% | 3.0% |
| Standard Deviation (Population) | 1.1% | 3.0% |
Similar Demographics by Hearing Disability
Demographics Similar to Guatemalans by Hearing Disability
In terms of hearing disability, the demographic groups most similar to Guatemalans are Turkish (2.8%, a difference of 0.070%), Honduran (2.8%, a difference of 0.080%), Immigrants from Chile (2.8%, a difference of 0.080%), Cypriot (2.8%, a difference of 0.12%), and Immigrants from Yemen (2.8%, a difference of 0.17%).
| Demographics | Rating | Rank | Hearing Disability |
| Immigrants | Spain | 94.9 /100 | #101 | Exceptional 2.8% |
| Taiwanese | 94.8 /100 | #102 | Exceptional 2.8% |
| Immigrants | Indonesia | 94.7 /100 | #103 | Exceptional 2.8% |
| Burmese | 94.2 /100 | #104 | Exceptional 2.8% |
| Moroccans | 93.9 /100 | #105 | Exceptional 2.8% |
| Hondurans | 93.4 /100 | #106 | Exceptional 2.8% |
| Immigrants | Chile | 93.4 /100 | #107 | Exceptional 2.8% |
| Guatemalans | 93.2 /100 | #108 | Exceptional 2.8% |
| Turks | 93.0 /100 | #109 | Exceptional 2.8% |
| Cypriots | 92.9 /100 | #110 | Exceptional 2.8% |
| Immigrants | Yemen | 92.7 /100 | #111 | Exceptional 2.8% |
| U.S. Virgin Islanders | 92.5 /100 | #112 | Exceptional 2.8% |
| Immigrants | Belarus | 91.6 /100 | #113 | Exceptional 2.8% |
| Cambodians | 91.1 /100 | #114 | Exceptional 2.8% |
| Immigrants | Latin America | 90.5 /100 | #115 | Exceptional 2.8% |
Demographics Similar to Sioux by Hearing Disability
In terms of hearing disability, the demographic groups most similar to Sioux are Delaware (3.6%, a difference of 0.030%), Immigrants from Micronesia (3.6%, a difference of 0.10%), Spanish (3.7%, a difference of 0.28%), Blackfeet (3.6%, a difference of 0.57%), and Swedish (3.6%, a difference of 0.82%).
| Demographics | Rating | Rank | Hearing Disability |
| Basques | 0.0 /100 | #278 | Tragic 3.6% |
| Slovaks | 0.0 /100 | #279 | Tragic 3.6% |
| French American Indians | 0.0 /100 | #280 | Tragic 3.6% |
| Scandinavians | 0.0 /100 | #281 | Tragic 3.6% |
| Swedes | 0.0 /100 | #282 | Tragic 3.6% |
| Blackfeet | 0.0 /100 | #283 | Tragic 3.6% |
| Immigrants | Micronesia | 0.0 /100 | #284 | Tragic 3.6% |
| Sioux | 0.0 /100 | #285 | Tragic 3.6% |
| Delaware | 0.0 /100 | #286 | Tragic 3.6% |
| Spanish | 0.0 /100 | #287 | Tragic 3.7% |
| Irish | 0.0 /100 | #288 | Tragic 3.7% |
| Chinese | 0.0 /100 | #289 | Tragic 3.7% |
| Whites/Caucasians | 0.0 /100 | #290 | Tragic 3.7% |
| Finns | 0.0 /100 | #291 | Tragic 3.7% |
| Native Hawaiians | 0.0 /100 | #292 | Tragic 3.7% |