Ugandan vs Sioux Hearing Disability
COMPARE
Ugandan
Sioux
Hearing Disability
Hearing Disability Comparison
Ugandans
Sioux
2.9%
HEARING DISABILITY
85.5/ 100
METRIC RATING
134th/ 347
METRIC RANK
3.6%
HEARING DISABILITY
0.0/ 100
METRIC RATING
285th/ 347
METRIC RANK
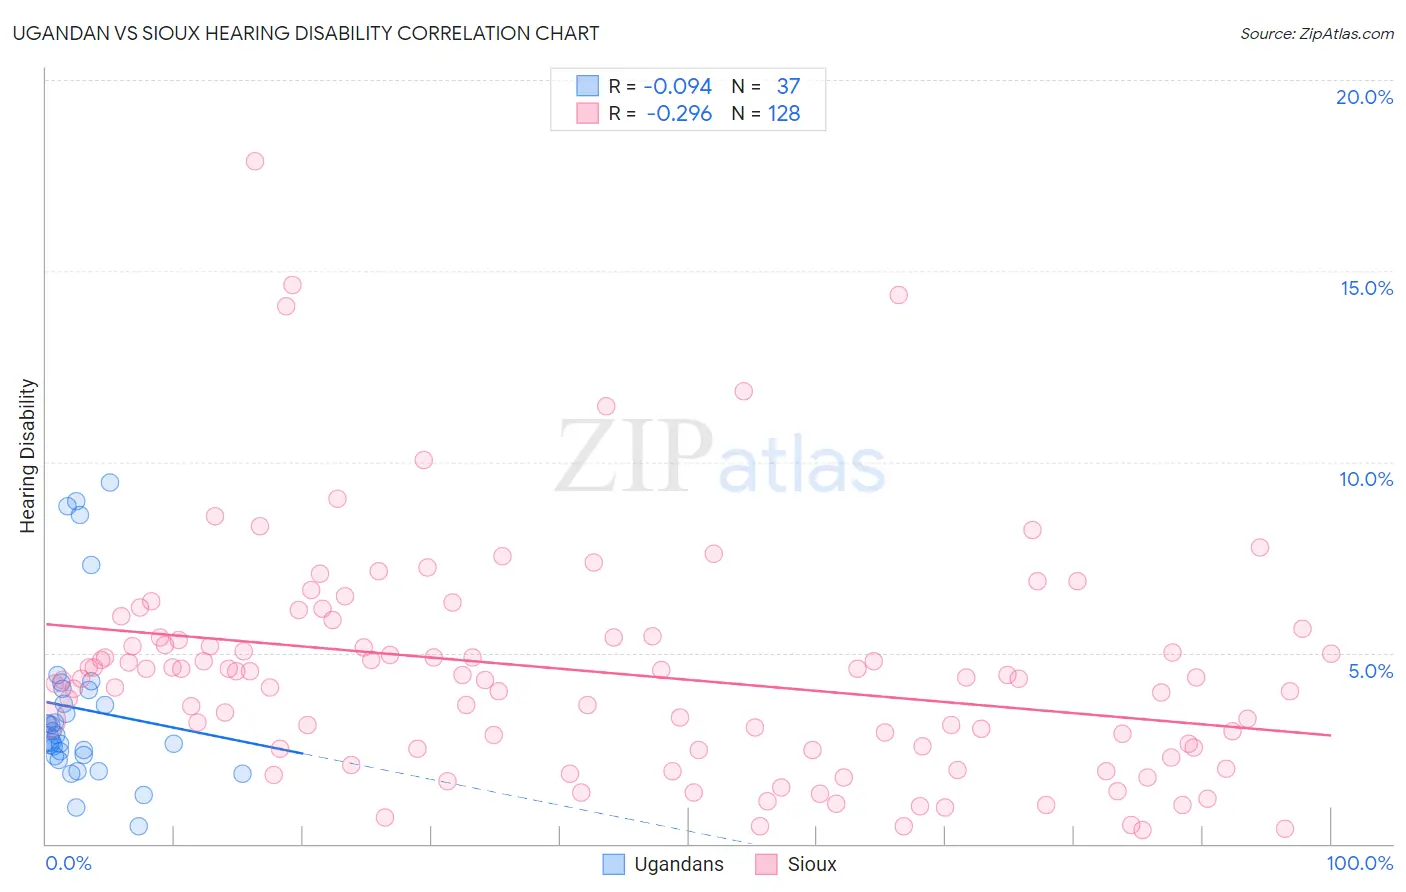
Ugandan vs Sioux Hearing Disability Correlation Chart
The statistical analysis conducted on geographies consisting of 94,015,951 people shows a slight negative correlation between the proportion of Ugandans and percentage of population with hearing disability in the United States with a correlation coefficient (R) of -0.094 and weighted average of 2.9%. Similarly, the statistical analysis conducted on geographies consisting of 234,128,884 people shows a weak negative correlation between the proportion of Sioux and percentage of population with hearing disability in the United States with a correlation coefficient (R) of -0.296 and weighted average of 3.6%, a difference of 26.8%.
Hearing Disability Correlation Summary
| Measurement | Ugandan | Sioux |
| Minimum | 0.45% | 0.37% |
| Maximum | 9.4% | 17.9% |
| Range | 9.0% | 17.5% |
| Mean | 3.5% | 4.5% |
| Median | 2.8% | 4.3% |
| Interquartile 25% (IQ1) | 2.3% | 2.5% |
| Interquartile 75% (IQ3) | 4.1% | 5.4% |
| Interquartile Range (IQR) | 1.7% | 2.9% |
| Standard Deviation (Sample) | 2.2% | 3.0% |
| Standard Deviation (Population) | 2.2% | 3.0% |
Similar Demographics by Hearing Disability
Demographics Similar to Ugandans by Hearing Disability
In terms of hearing disability, the demographic groups most similar to Ugandans are Chilean (2.9%, a difference of 0.070%), Immigrants from Syria (2.9%, a difference of 0.070%), Immigrants from Kenya (2.9%, a difference of 0.13%), Soviet Union (2.9%, a difference of 0.14%), and Immigrants from Brazil (2.9%, a difference of 0.17%).
| Demographics | Rating | Rank | Hearing Disability |
| South American Indians | 86.9 /100 | #127 | Excellent 2.9% |
| Immigrants | Western Asia | 86.9 /100 | #128 | Excellent 2.9% |
| Immigrants | Uganda | 86.6 /100 | #129 | Excellent 2.9% |
| Immigrants | Vietnam | 86.5 /100 | #130 | Excellent 2.9% |
| Immigrants | Kenya | 86.1 /100 | #131 | Excellent 2.9% |
| Chileans | 85.8 /100 | #132 | Excellent 2.9% |
| Immigrants | Syria | 85.8 /100 | #133 | Excellent 2.9% |
| Ugandans | 85.5 /100 | #134 | Excellent 2.9% |
| Soviet Union | 84.8 /100 | #135 | Excellent 2.9% |
| Immigrants | Brazil | 84.6 /100 | #136 | Excellent 2.9% |
| Sri Lankans | 84.1 /100 | #137 | Excellent 2.9% |
| Immigrants | Costa Rica | 84.0 /100 | #138 | Excellent 2.9% |
| Bermudans | 83.8 /100 | #139 | Excellent 2.9% |
| Immigrants | Jordan | 83.7 /100 | #140 | Excellent 2.9% |
| Sub-Saharan Africans | 83.3 /100 | #141 | Excellent 2.9% |
Demographics Similar to Sioux by Hearing Disability
In terms of hearing disability, the demographic groups most similar to Sioux are Delaware (3.6%, a difference of 0.030%), Immigrants from Micronesia (3.6%, a difference of 0.10%), Spanish (3.7%, a difference of 0.28%), Blackfeet (3.6%, a difference of 0.57%), and Swedish (3.6%, a difference of 0.82%).
| Demographics | Rating | Rank | Hearing Disability |
| Basques | 0.0 /100 | #278 | Tragic 3.6% |
| Slovaks | 0.0 /100 | #279 | Tragic 3.6% |
| French American Indians | 0.0 /100 | #280 | Tragic 3.6% |
| Scandinavians | 0.0 /100 | #281 | Tragic 3.6% |
| Swedes | 0.0 /100 | #282 | Tragic 3.6% |
| Blackfeet | 0.0 /100 | #283 | Tragic 3.6% |
| Immigrants | Micronesia | 0.0 /100 | #284 | Tragic 3.6% |
| Sioux | 0.0 /100 | #285 | Tragic 3.6% |
| Delaware | 0.0 /100 | #286 | Tragic 3.6% |
| Spanish | 0.0 /100 | #287 | Tragic 3.7% |
| Irish | 0.0 /100 | #288 | Tragic 3.7% |
| Chinese | 0.0 /100 | #289 | Tragic 3.7% |
| Whites/Caucasians | 0.0 /100 | #290 | Tragic 3.7% |
| Finns | 0.0 /100 | #291 | Tragic 3.7% |
| Native Hawaiians | 0.0 /100 | #292 | Tragic 3.7% |