Colombian vs Sioux Hearing Disability
COMPARE
Colombian
Sioux
Hearing Disability
Hearing Disability Comparison
Colombians
Sioux
2.7%
HEARING DISABILITY
97.4/ 100
METRIC RATING
79th/ 347
METRIC RANK
3.6%
HEARING DISABILITY
0.0/ 100
METRIC RATING
285th/ 347
METRIC RANK
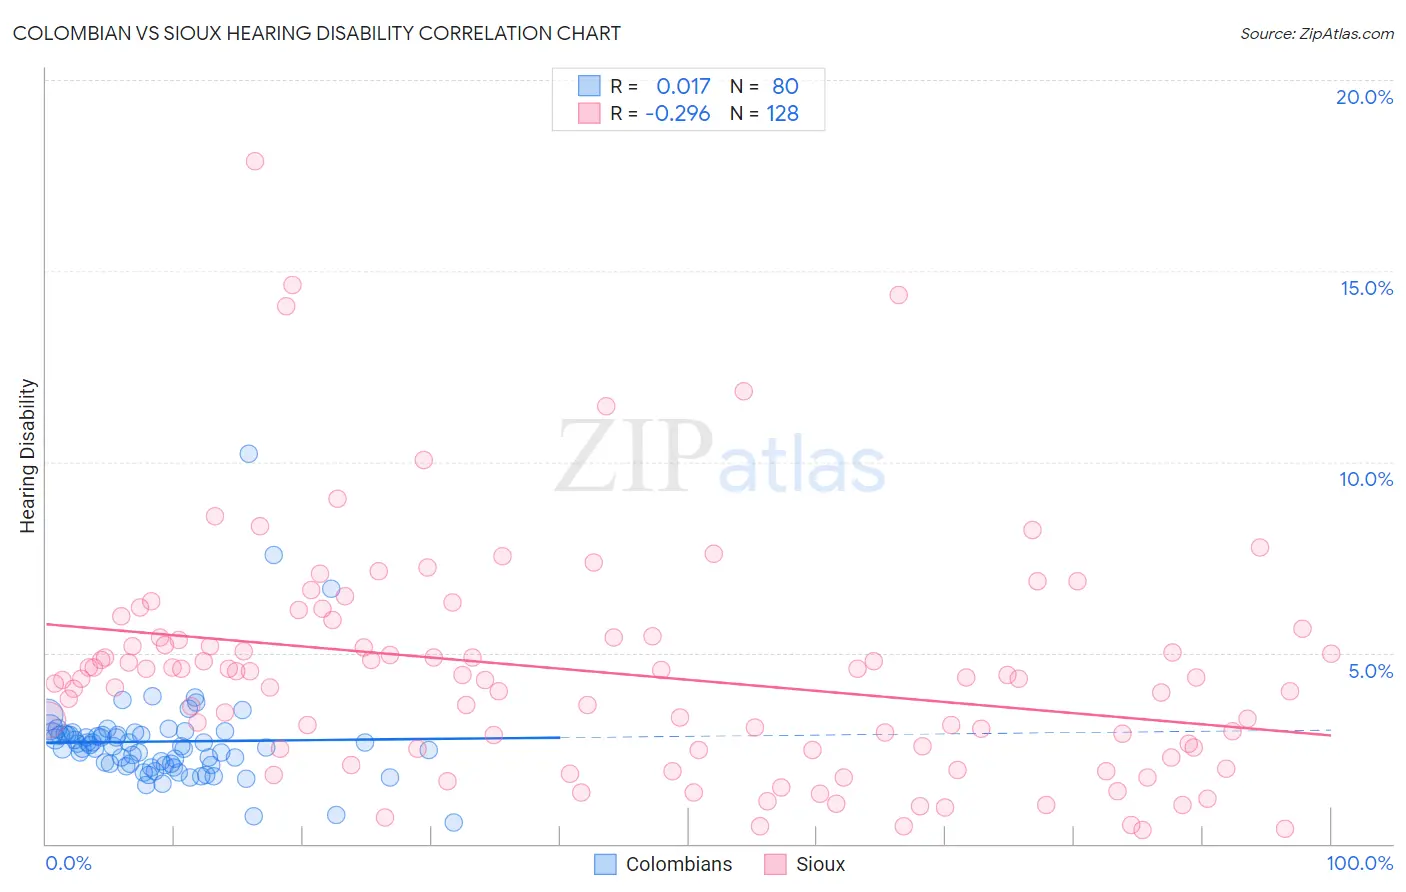
Colombian vs Sioux Hearing Disability Correlation Chart
The statistical analysis conducted on geographies consisting of 419,423,725 people shows no correlation between the proportion of Colombians and percentage of population with hearing disability in the United States with a correlation coefficient (R) of 0.017 and weighted average of 2.7%. Similarly, the statistical analysis conducted on geographies consisting of 234,128,884 people shows a weak negative correlation between the proportion of Sioux and percentage of population with hearing disability in the United States with a correlation coefficient (R) of -0.296 and weighted average of 3.6%, a difference of 32.9%.
Hearing Disability Correlation Summary
| Measurement | Colombian | Sioux |
| Minimum | 0.57% | 0.37% |
| Maximum | 10.2% | 17.9% |
| Range | 9.7% | 17.5% |
| Mean | 2.7% | 4.5% |
| Median | 2.6% | 4.3% |
| Interquartile 25% (IQ1) | 2.1% | 2.5% |
| Interquartile 75% (IQ3) | 2.9% | 5.4% |
| Interquartile Range (IQR) | 0.79% | 2.9% |
| Standard Deviation (Sample) | 1.3% | 3.0% |
| Standard Deviation (Population) | 1.3% | 3.0% |
Similar Demographics by Hearing Disability
Demographics Similar to Colombians by Hearing Disability
In terms of hearing disability, the demographic groups most similar to Colombians are Mongolian (2.7%, a difference of 0.020%), Immigrants from Malaysia (2.7%, a difference of 0.060%), Asian (2.7%, a difference of 0.080%), Immigrants from Saudi Arabia (2.7%, a difference of 0.090%), and Immigrants from Korea (2.7%, a difference of 0.11%).
| Demographics | Rating | Rank | Hearing Disability |
| Afghans | 97.6 /100 | #72 | Exceptional 2.7% |
| Argentineans | 97.5 /100 | #73 | Exceptional 2.7% |
| Immigrants | Korea | 97.5 /100 | #74 | Exceptional 2.7% |
| Immigrants | Saudi Arabia | 97.5 /100 | #75 | Exceptional 2.7% |
| Asians | 97.5 /100 | #76 | Exceptional 2.7% |
| Immigrants | Malaysia | 97.5 /100 | #77 | Exceptional 2.7% |
| Mongolians | 97.4 /100 | #78 | Exceptional 2.7% |
| Colombians | 97.4 /100 | #79 | Exceptional 2.7% |
| Immigrants | Asia | 97.2 /100 | #80 | Exceptional 2.7% |
| Immigrants | Uruguay | 97.2 /100 | #81 | Exceptional 2.7% |
| Immigrants | Armenia | 97.2 /100 | #82 | Exceptional 2.7% |
| Immigrants | Cuba | 97.2 /100 | #83 | Exceptional 2.7% |
| Immigrants | Argentina | 97.0 /100 | #84 | Exceptional 2.8% |
| Immigrants | Northern Africa | 96.9 /100 | #85 | Exceptional 2.8% |
| Immigrants | Iran | 96.8 /100 | #86 | Exceptional 2.8% |
Demographics Similar to Sioux by Hearing Disability
In terms of hearing disability, the demographic groups most similar to Sioux are Delaware (3.6%, a difference of 0.030%), Immigrants from Micronesia (3.6%, a difference of 0.10%), Spanish (3.7%, a difference of 0.28%), Blackfeet (3.6%, a difference of 0.57%), and Swedish (3.6%, a difference of 0.82%).
| Demographics | Rating | Rank | Hearing Disability |
| Basques | 0.0 /100 | #278 | Tragic 3.6% |
| Slovaks | 0.0 /100 | #279 | Tragic 3.6% |
| French American Indians | 0.0 /100 | #280 | Tragic 3.6% |
| Scandinavians | 0.0 /100 | #281 | Tragic 3.6% |
| Swedes | 0.0 /100 | #282 | Tragic 3.6% |
| Blackfeet | 0.0 /100 | #283 | Tragic 3.6% |
| Immigrants | Micronesia | 0.0 /100 | #284 | Tragic 3.6% |
| Sioux | 0.0 /100 | #285 | Tragic 3.6% |
| Delaware | 0.0 /100 | #286 | Tragic 3.6% |
| Spanish | 0.0 /100 | #287 | Tragic 3.7% |
| Irish | 0.0 /100 | #288 | Tragic 3.7% |
| Chinese | 0.0 /100 | #289 | Tragic 3.7% |
| Whites/Caucasians | 0.0 /100 | #290 | Tragic 3.7% |
| Finns | 0.0 /100 | #291 | Tragic 3.7% |
| Native Hawaiians | 0.0 /100 | #292 | Tragic 3.7% |