Ecuadorian vs Immigrants from Albania Female Disability
COMPARE
Ecuadorian
Immigrants from Albania
Female Disability
Female Disability Comparison
Ecuadorians
Immigrants from Albania
11.9%
FEMALE DISABILITY
93.4/ 100
METRIC RATING
138th/ 347
METRIC RANK
12.3%
FEMALE DISABILITY
31.6/ 100
METRIC RATING
189th/ 347
METRIC RANK
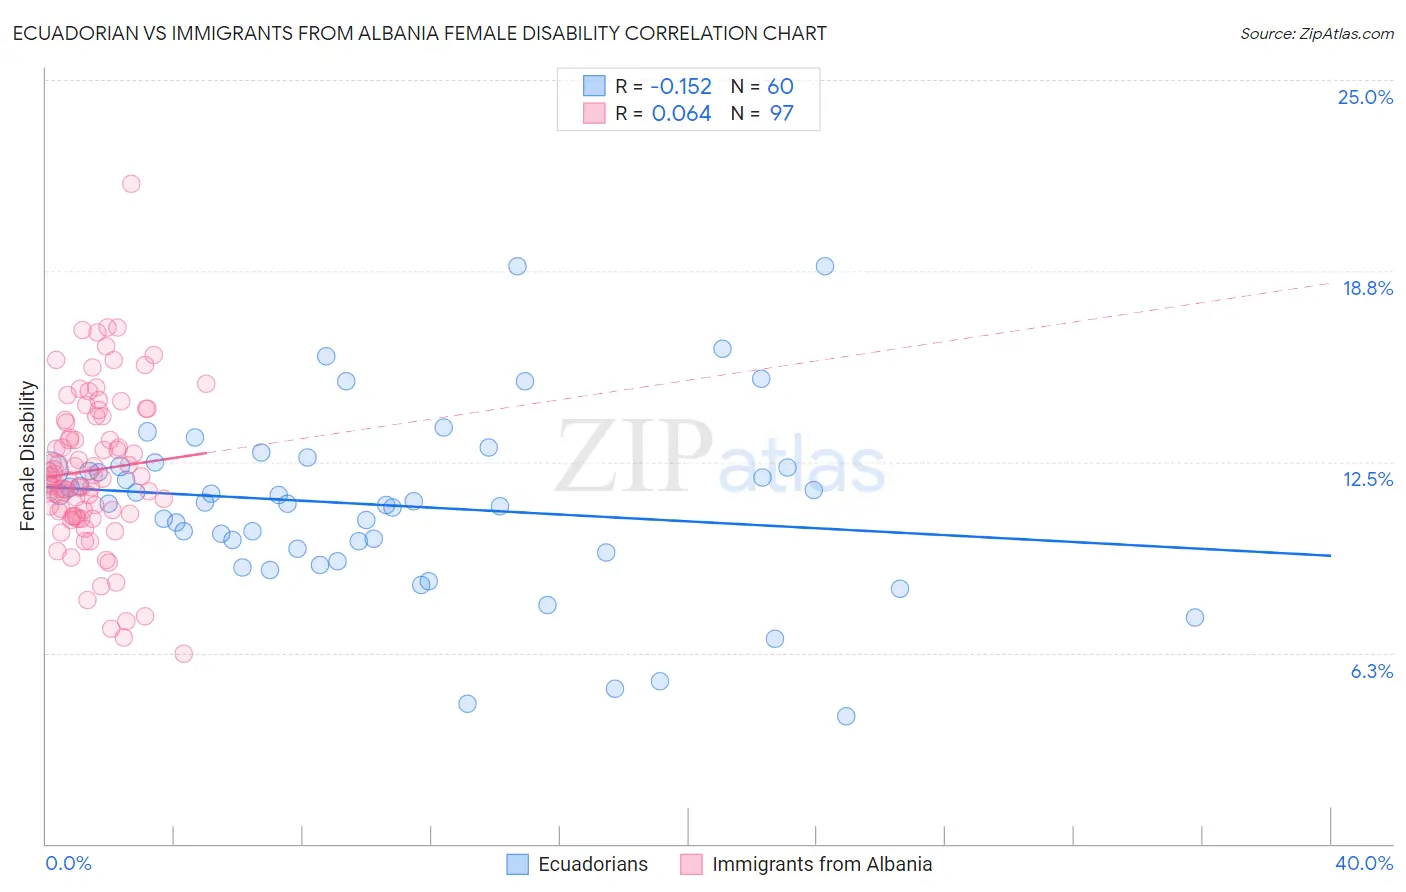
Ecuadorian vs Immigrants from Albania Female Disability Correlation Chart
The statistical analysis conducted on geographies consisting of 317,804,285 people shows a poor negative correlation between the proportion of Ecuadorians and percentage of females with a disability in the United States with a correlation coefficient (R) of -0.152 and weighted average of 11.9%. Similarly, the statistical analysis conducted on geographies consisting of 119,399,114 people shows a slight positive correlation between the proportion of Immigrants from Albania and percentage of females with a disability in the United States with a correlation coefficient (R) of 0.064 and weighted average of 12.3%, a difference of 3.3%.
Female Disability Correlation Summary
| Measurement | Ecuadorian | Immigrants from Albania |
| Minimum | 4.2% | 6.2% |
| Maximum | 18.9% | 21.6% |
| Range | 14.7% | 15.4% |
| Mean | 11.1% | 12.2% |
| Median | 11.2% | 12.0% |
| Interquartile 25% (IQ1) | 9.6% | 10.8% |
| Interquartile 75% (IQ3) | 12.3% | 13.9% |
| Interquartile Range (IQR) | 2.7% | 3.1% |
| Standard Deviation (Sample) | 2.9% | 2.5% |
| Standard Deviation (Population) | 2.9% | 2.5% |
Similar Demographics by Female Disability
Demographics Similar to Ecuadorians by Female Disability
In terms of female disability, the demographic groups most similar to Ecuadorians are Immigrants from Norway (11.9%, a difference of 0.060%), Immigrants from Hungary (11.9%, a difference of 0.090%), Ugandan (11.9%, a difference of 0.10%), Central American (11.9%, a difference of 0.12%), and Kenyan (11.9%, a difference of 0.19%).
| Demographics | Rating | Rank | Female Disability |
| Arabs | 95.1 /100 | #131 | Exceptional 11.9% |
| Immigrants | Syria | 94.6 /100 | #132 | Exceptional 11.9% |
| Kenyans | 94.5 /100 | #133 | Exceptional 11.9% |
| Immigrants | Nicaragua | 94.5 /100 | #134 | Exceptional 11.9% |
| Central Americans | 94.2 /100 | #135 | Exceptional 11.9% |
| Ugandans | 94.0 /100 | #136 | Exceptional 11.9% |
| Immigrants | Norway | 93.8 /100 | #137 | Exceptional 11.9% |
| Ecuadorians | 93.4 /100 | #138 | Exceptional 11.9% |
| Immigrants | Hungary | 92.8 /100 | #139 | Exceptional 11.9% |
| Romanians | 91.6 /100 | #140 | Exceptional 11.9% |
| Immigrants | Ecuador | 91.5 /100 | #141 | Exceptional 11.9% |
| Immigrants | Africa | 90.0 /100 | #142 | Excellent 11.9% |
| Immigrants | Sudan | 89.6 /100 | #143 | Excellent 11.9% |
| Immigrants | Austria | 87.9 /100 | #144 | Excellent 12.0% |
| Estonians | 87.8 /100 | #145 | Excellent 12.0% |
Demographics Similar to Immigrants from Albania by Female Disability
In terms of female disability, the demographic groups most similar to Immigrants from Albania are Immigrants from Honduras (12.3%, a difference of 0.010%), Immigrants from North America (12.3%, a difference of 0.050%), Serbian (12.3%, a difference of 0.070%), Austrian (12.3%, a difference of 0.080%), and Armenian (12.3%, a difference of 0.080%).
| Demographics | Rating | Rank | Female Disability |
| Norwegians | 36.9 /100 | #182 | Fair 12.3% |
| Cubans | 36.5 /100 | #183 | Fair 12.3% |
| Iraqis | 36.0 /100 | #184 | Fair 12.3% |
| Immigrants | Uzbekistan | 33.9 /100 | #185 | Fair 12.3% |
| Austrians | 33.3 /100 | #186 | Fair 12.3% |
| Serbians | 33.1 /100 | #187 | Fair 12.3% |
| Immigrants | North America | 32.8 /100 | #188 | Fair 12.3% |
| Immigrants | Albania | 31.6 /100 | #189 | Fair 12.3% |
| Immigrants | Honduras | 31.3 /100 | #190 | Fair 12.3% |
| Armenians | 29.7 /100 | #191 | Fair 12.3% |
| Immigrants | Western Africa | 29.2 /100 | #192 | Fair 12.3% |
| Northern Europeans | 27.5 /100 | #193 | Fair 12.3% |
| Ukrainians | 27.2 /100 | #194 | Fair 12.3% |
| Swedes | 26.6 /100 | #195 | Fair 12.3% |
| Immigrants | Panama | 25.5 /100 | #196 | Fair 12.3% |